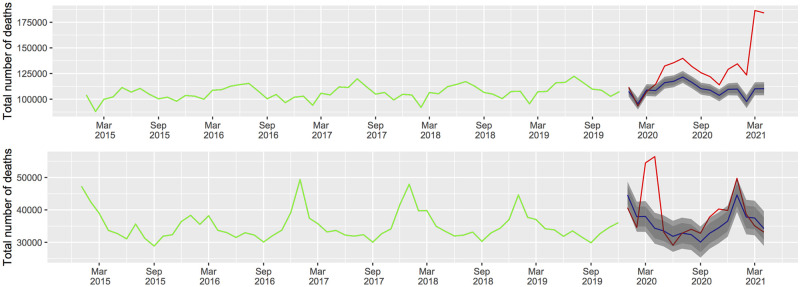
Fig 3. Total number of deaths by all causes observed and forecast of the ARIMA models.
Left hand side Brazil; right hand side Spain; the green line corresponds to the observed deaths from January 2015 to December 2019; the red line corresponds to the observed deaths from January 2020 to April 2021; the blue line corresponds to the forecasts in the absence of the COVID-19 pandemic based on the ARIMA models with their respective prediction intervals. Lags units in months.

