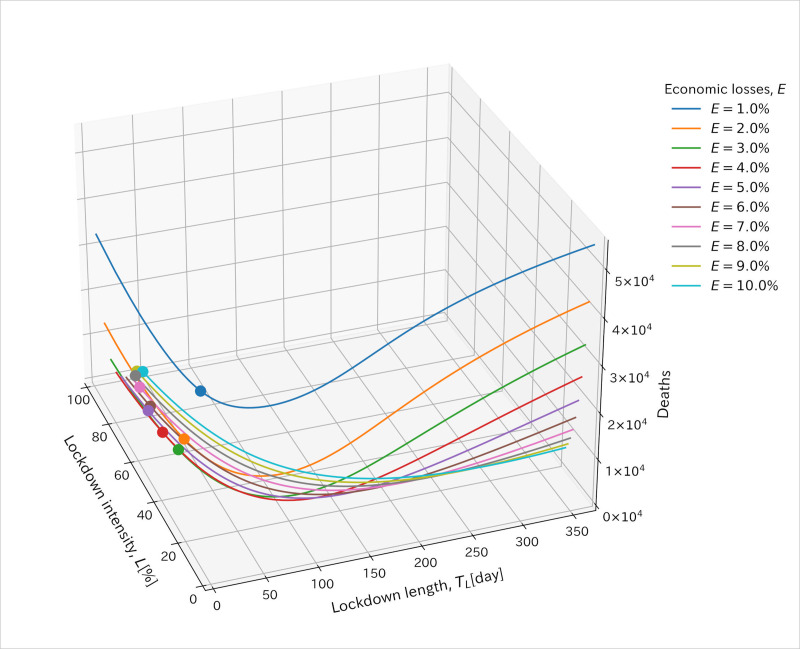
Fig 2. Illustration of relationship between economic loss and lockdown intensity and length values.
x and y axis represent lockdown intensity and length values. z axis represents the cumulative number of deaths at the end of the simulations. Each line was drawn with the same volume of economic loss, E. Points show the minimum cumulative number of deaths for each line. Values at these points were used for the optimized parameters and shown in the following figures.

