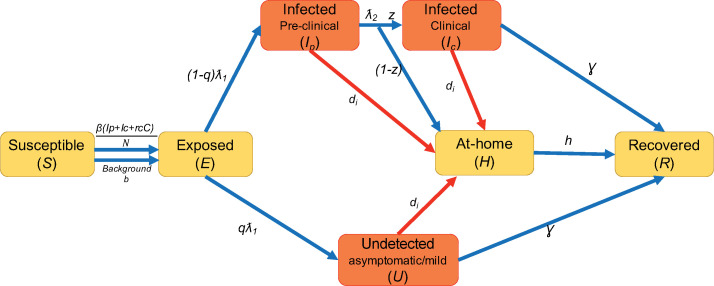
Fig 1. Schematic for compartmental transmission model.
Orange boxes represent classes of individuals that contribute to transmission, and that are also detectable via PCR. Blue arrows represent processes that are modeled as differential equations in the deterministic model, and refer to transmission and disease progression processes. Red arrows represent screening and testing measures in the model, which occur at specific intervals. Red and blue arrows are included in the stochastic model. Parameters that determine the rate at which individuals transition between compartments are defined in Table A in the S1 Appendix.

