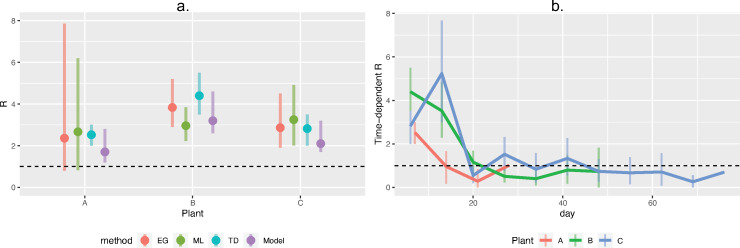
Fig 6. R estimates.
a) Comparison of R estimates using different estimation techniques. Colors indicate each technique: EG: Exponential growth; ML: Maximum likelihood; TD: R-TD during the first week; Model: Estimate from the tuned compartmental model. b) Time-dependent R estimated at a weekly interval for each plant. In both panels, black hashed line shows R = 1.

