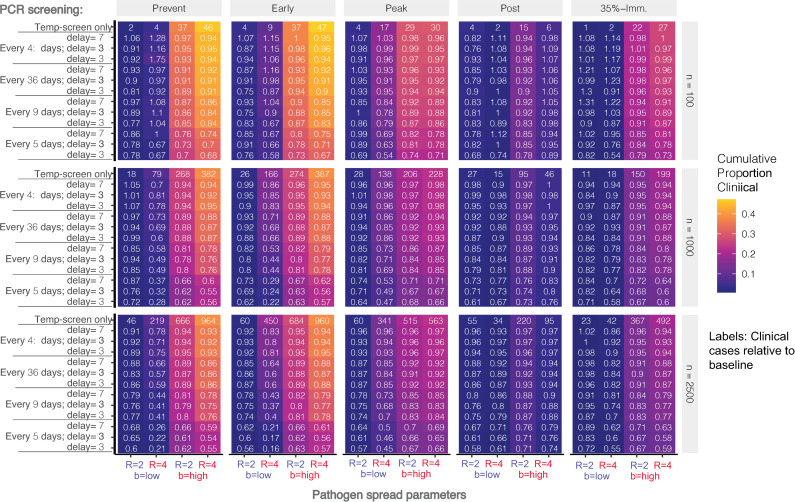
Fig 7. Proportion of expected clinical cases averted by PCR-screening relative to baseline of temperature screening alone.
Results are stratified according to stage at which PCR-screening is implemented (Prevention, Early, Peak, Post, 35% Immune), workforce size (n = 100, 1000, 2500), and high/low workforce R and background transmission rates. Absolute number of expected clinical cases under the baseline is labeled in the top line of each colored block, and each cell label shows the clinical cases relative to baseline (Casesscenario / Casesbaseline). Colored shading indicates the cumulative proportion of the workforce that experience clinical disease.

