Figure 1.

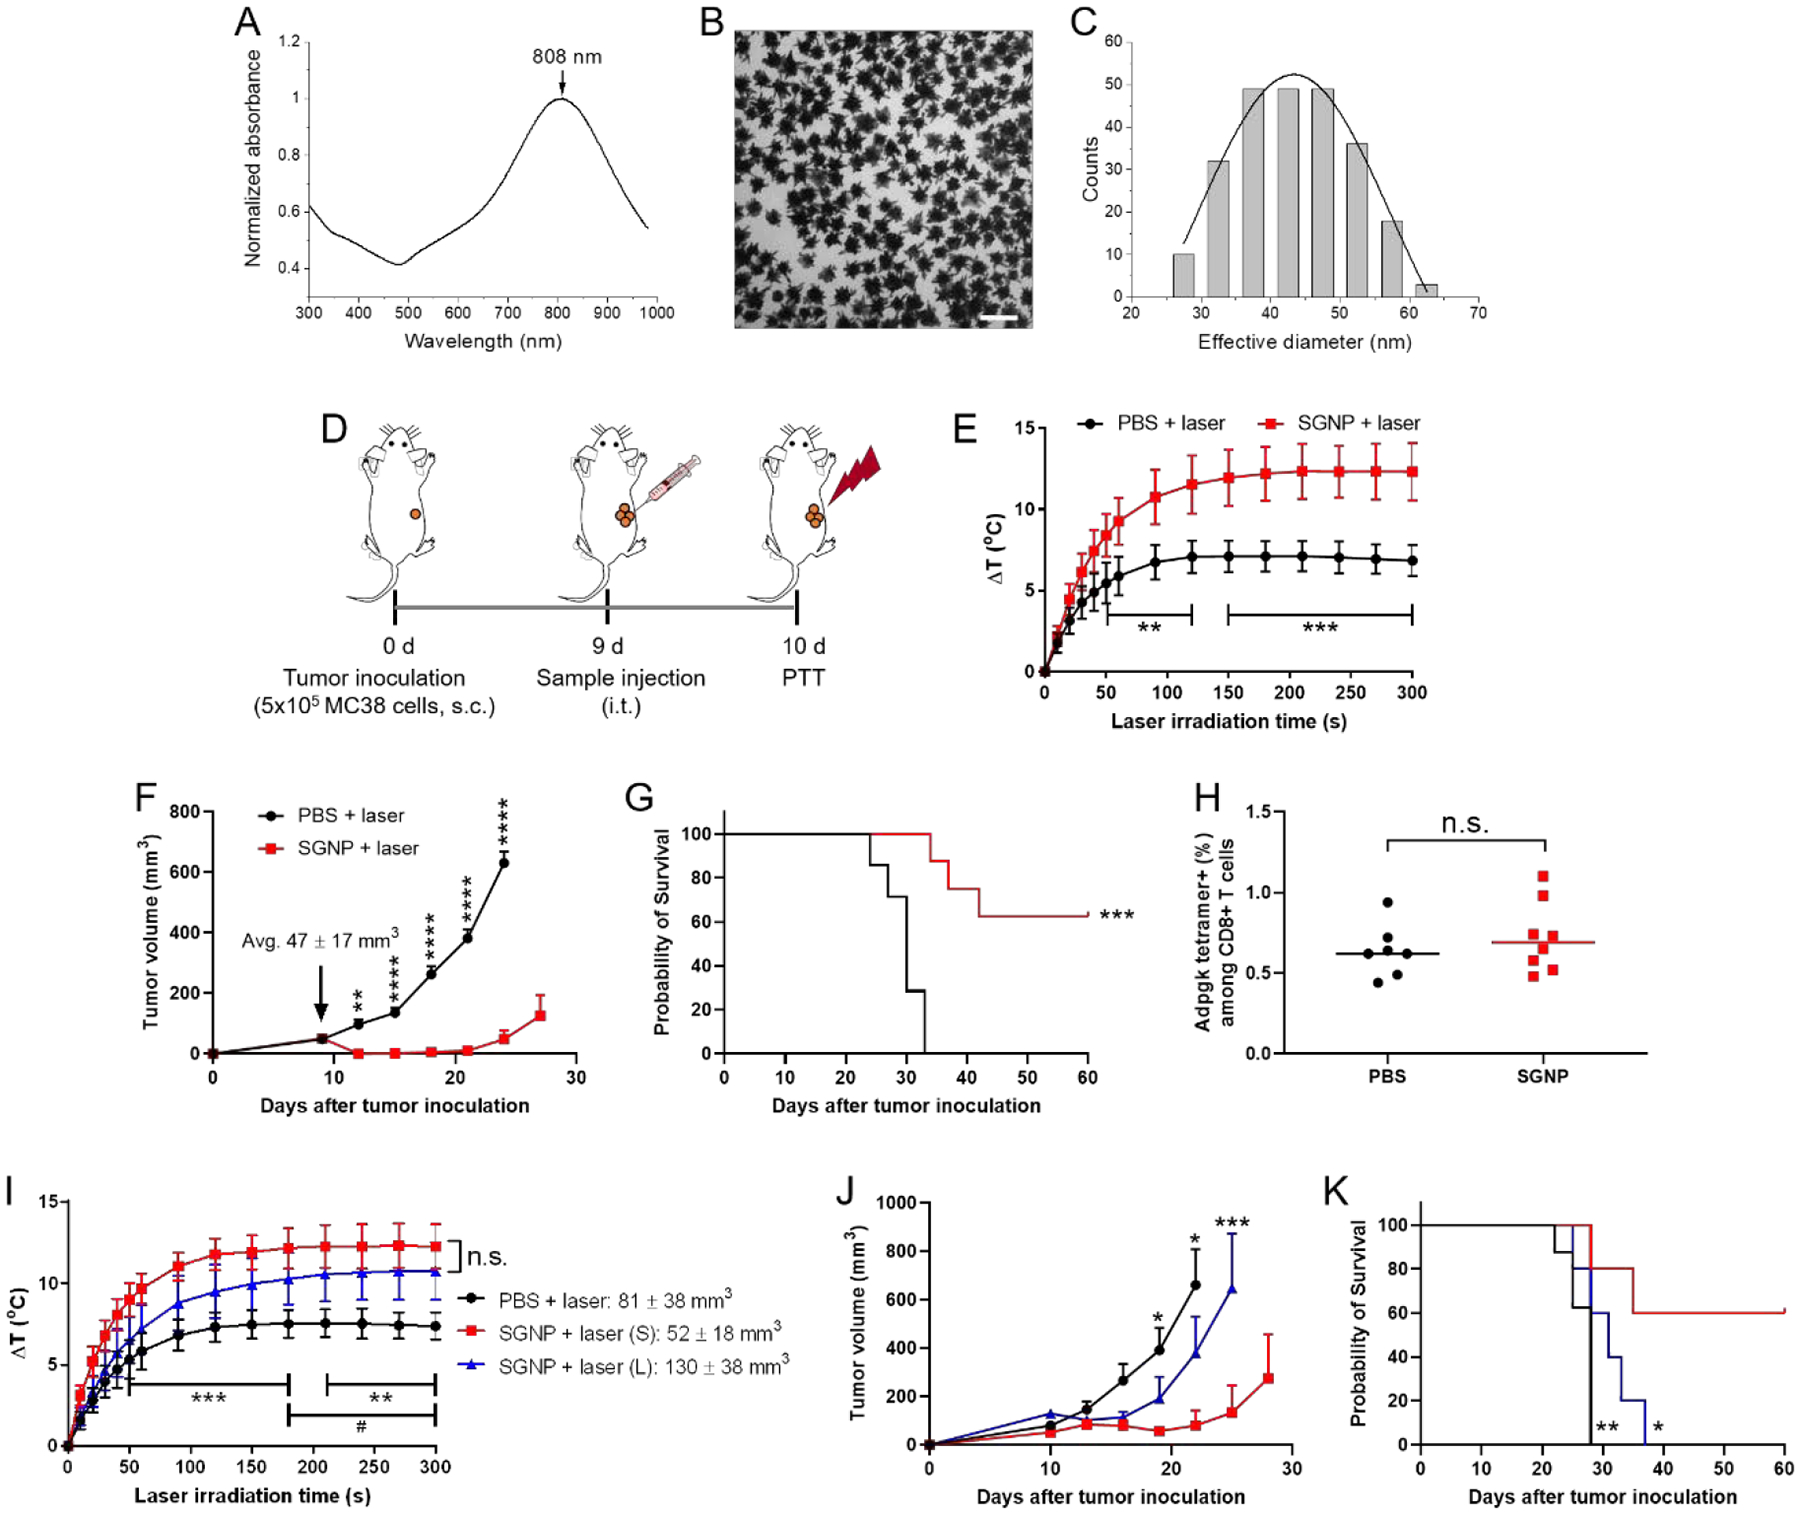
Tumor ablation by SGNP-mediated NIR PTT. (A-C) Absorption spectrum (A), TEM image (B) and the corresponding size distribution (C) of SGNPs. Scale bar = 100 nm. (D) Schematic of PTT regimen. (E) Increase in the local temperature in tumors during laser irradiation. (F,G) Tumor growth (F), and Kaplan–Meier survival curve (G) of MC38 tumor-bearing mice after administration of PBS or SGNP, followed by laser irradiation. (H) Frequency of Adpgk-specific CD8+ T cells in PBMCs, measured by flow cytometry after 7 days post laser irradiation. (I-K) Local temperature increase in the tumors during laser irradiation (I), tumor growth (J), and Kaplan–Meier survival curve (K) of MC38 tumor-bearing mice depending on the tumor size. Small and large tumors are denoted by (S) and (L), respectively. The data show mean ± s.d. (E,I) or s.e.m. (F,J), with n = 7 (PBS + laser) or n = 8 (SGNP + laser) for (E-H) and n = 8 (PBS) or n = 5 (other groups) for (I-K). *P < 0.05, **P < 0.01, ***P < 0.001, and ****P < 0.0001, analyzed by unpaired, two-tailed t-test with Welch’s correction (H), two-way ANOVA with Bonferroni multiple comparisons post-test (E,F,I,J), or by log-rank (Mantel–Cox) test (G,K), for comparison with SGNP + laser (S) (*), or PBS + laser vs. SGNP + laser (L) (#).
