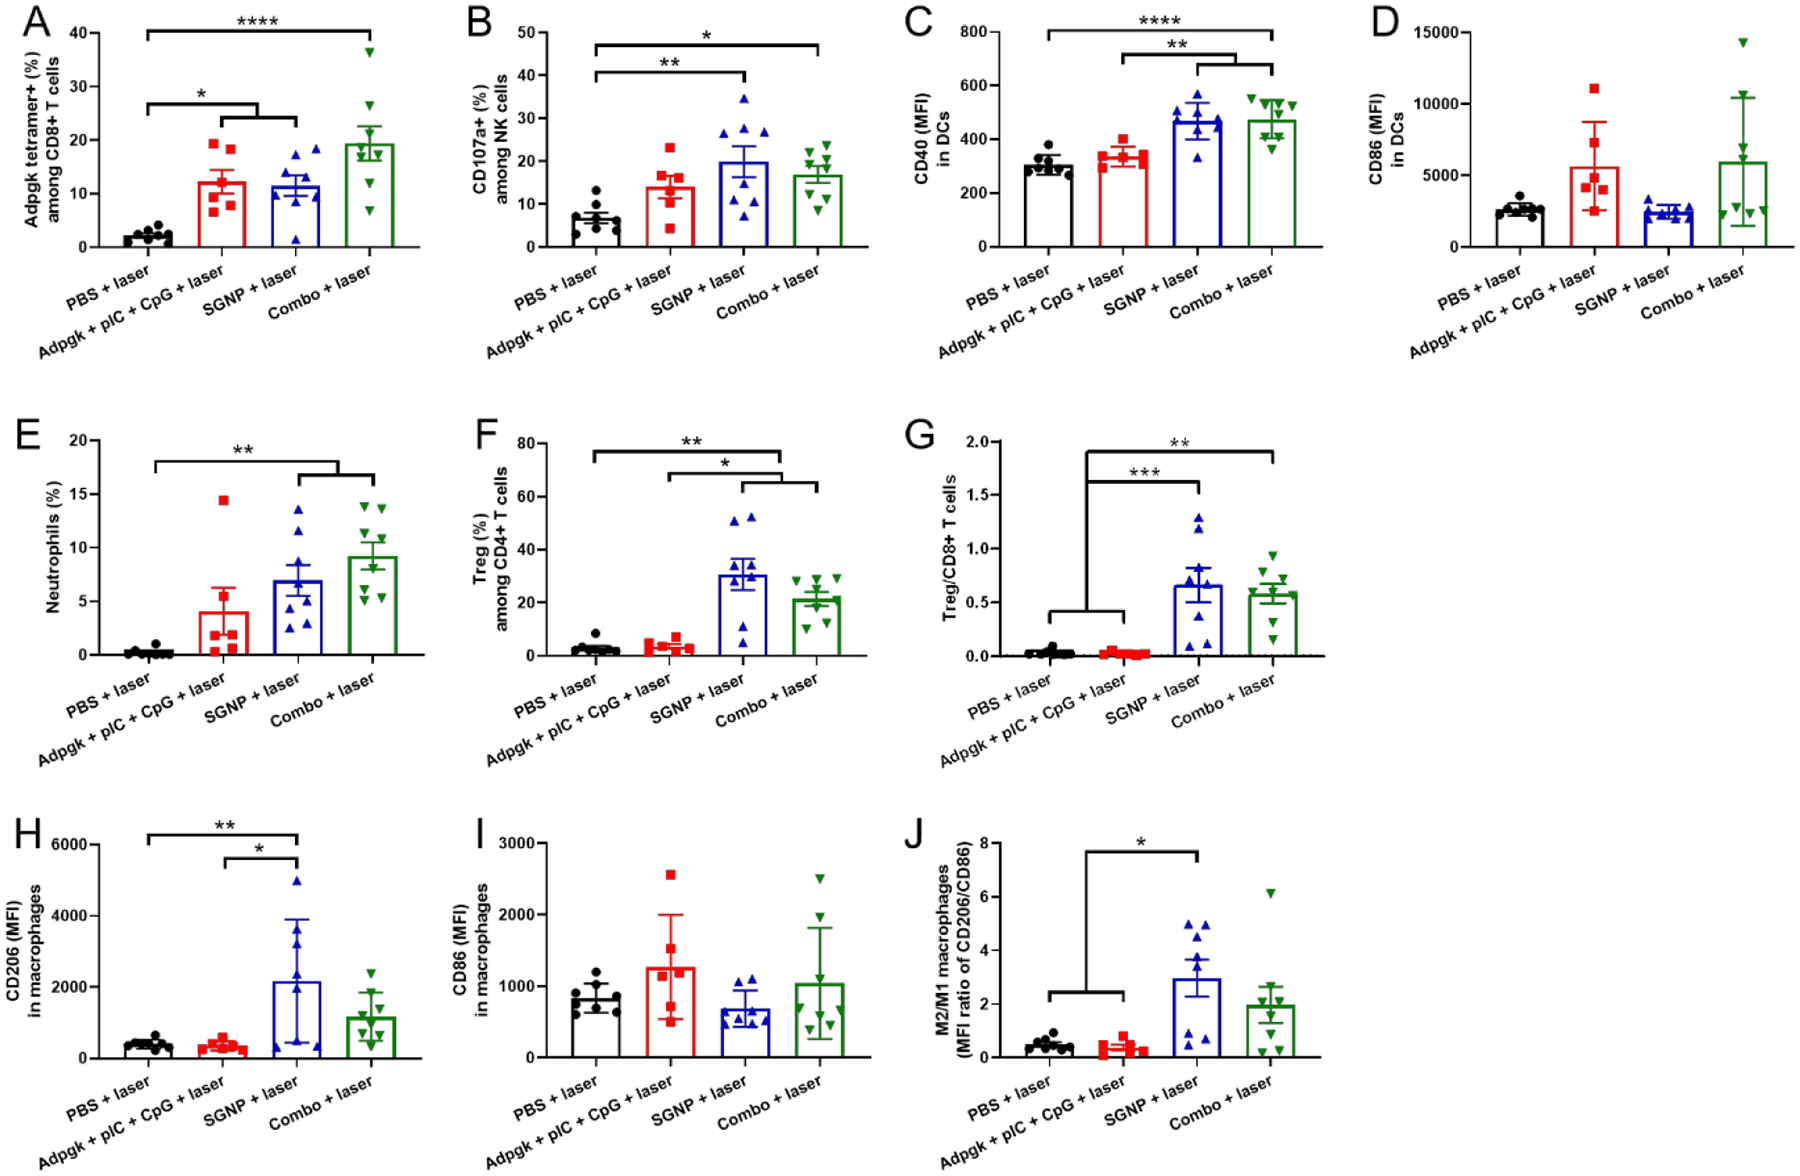
Figure 4.

Immune cell analysis in the directly treated primary tumors after 7 days of laser irradiation. (A,B) Frequency of Adpgk-specific CD8+ T cells (A) and CD107a+ NK cells (B). (C,D) MFI of CD40 (C) and CD86 (D) in DCs. (E-G) Frequency of neutrophils (E) and Tregs (F), and the ratio of Treg/CD8+ T cells (G). (H-J) MFI of CD206 (H) and CD86 (I) in macrophages and the corresponding ratio of M2/M1-like macrophages (J). The data show mean ± s.e.m., with n = 6 (Adpgk + pIC + CpG + laser) or n = 8 (other groups). *P < 0.05, **P < 0.01, ***P < 0.001, and ****P < 0.0001, analyzed by one-way ANOVA with Bonferroni multiple comparisons post-test.
