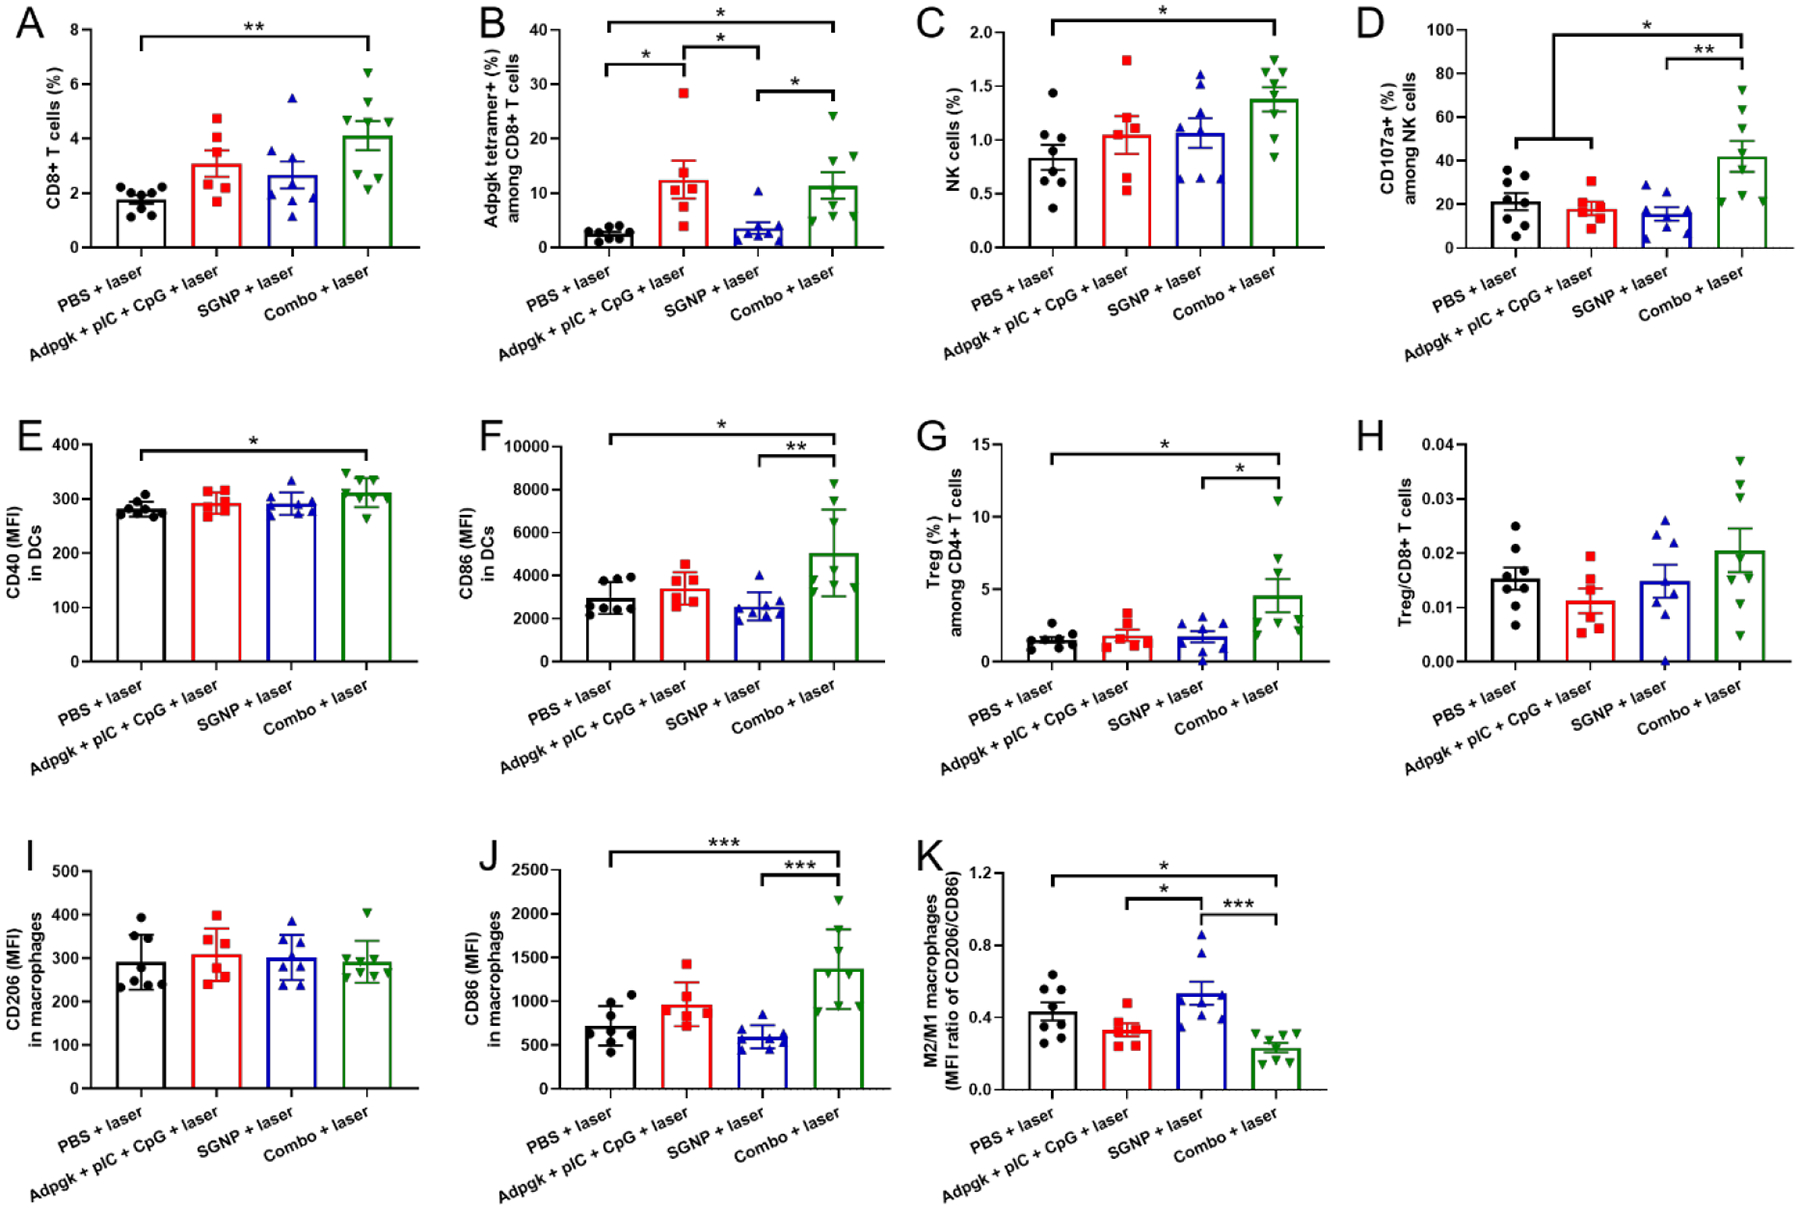
Figure 5.

Immune cell analysis in the untreated contralateral tumors. (A-D) Frequency of CD8+ T cells (A) and NK cells (C), and their activation analyzed by Adpgk tetramer staining (B) and CD107a expression (D). (E,F) MFI of CD40 (E) and CD86 (F) in DCs. (G,H) Frequency of Tregs (G) and the ratio of Treg/CD8+ T cells (H). (I-K) MFI of CD206 (I) and CD86 (J) in macrophages and the corresponding ratio of M2/M1-like macrophages (K). The data show mean ± s.e.m., with n = 6 (Adpgk + pIC + CpG + laser) or n = 8 (other groups). *P < 0.05, **P < 0.01, ***P < 0.001, and ****P < 0.0001, analyzed by one-way ANOVA with Bonferroni multiple comparisons post-test.
