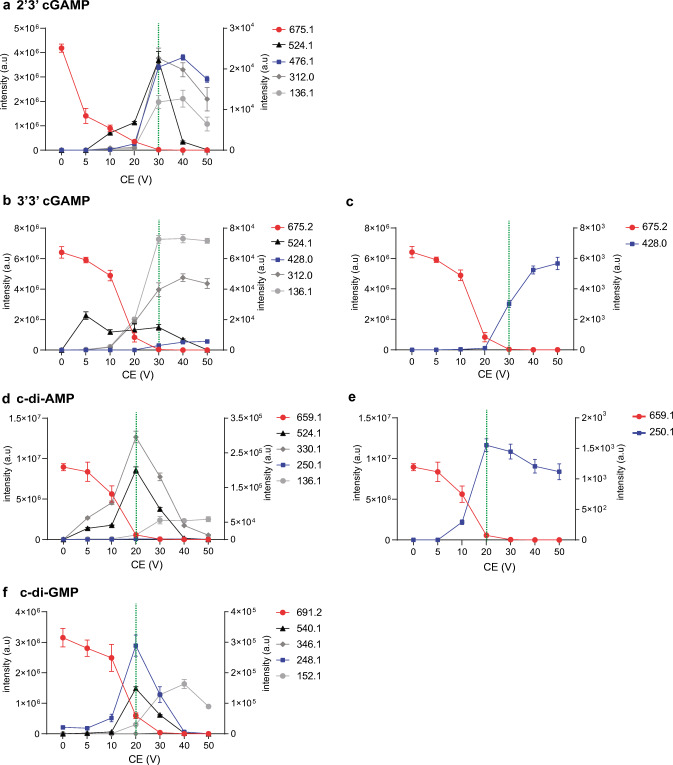
Fig. 3.
Breakdown curves of selected product ions for CDNs. Precursor and product ion yields are plotted as a function of collision energy (CE) settings for 2′3′ cGAMP (a), 3′3′ cGAMP (b), with zoom in on specific ion products for 3′3′ cGAMP (c), c-di-AMP (d), with zoom in on specific ion product for c-di-AMP (e), and c-di-GMP (f). Precursor ion intensity is plotted on the left y-axis, and product ion intensities are plotted on the right y-axis. Collision energies selected for the MRM method are indicated by the dotted green bar

