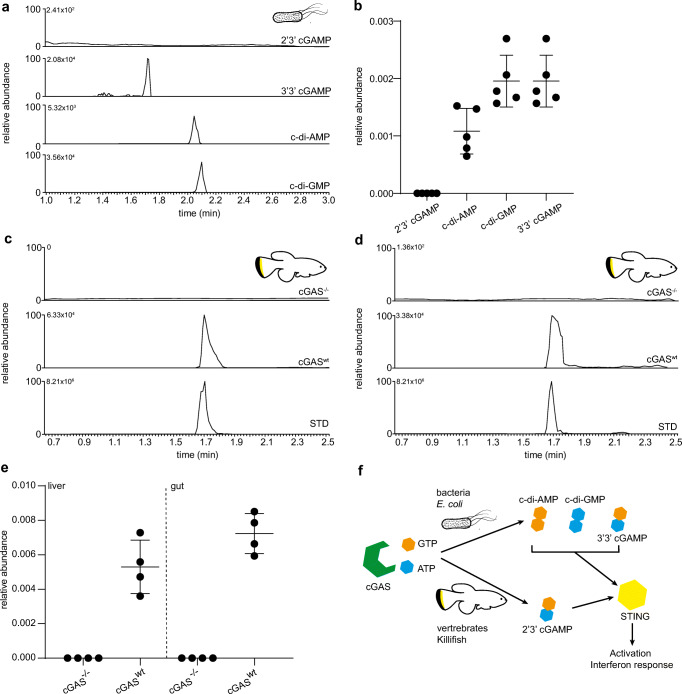
Fig. 4.
Method validation and quantification of CDNs in vivo. a Quantification of CDNs in E. coli using the optimized LC-MS/MS parameters. b Relative abundance of CDNs is calculated by dividing the CDN peak area with the internal standard peak area and further normalized to protein levels. Quantification of 2′3′ cGAMP in liver (c) and gut (d) of killifish by LC-MS/MS. The first chromatogram is obtained from the mutant with non-functional cGAS (cGAS−/−), the second chromatogram from the laboratory wild-type killifish GRZ-Ad (cGASwt). The bottom chromatogram corresponds to the 2′3′ cGAMP standard. e Relative quantification of 2′3′ cGAMP in the killifish tissues. Relative quantification is calculated by dividing the CDN peak area with the internal standard peak area and further normalized to protein levels. f Representation of the cGAS/Sting pathways in bacteria and vertebrates. Bacteria synthesize only c-di AMP, c-di-GMP, and 3′3′ cGAMP, whereas vertebrates only synthesize 2′3′ cGAMP

