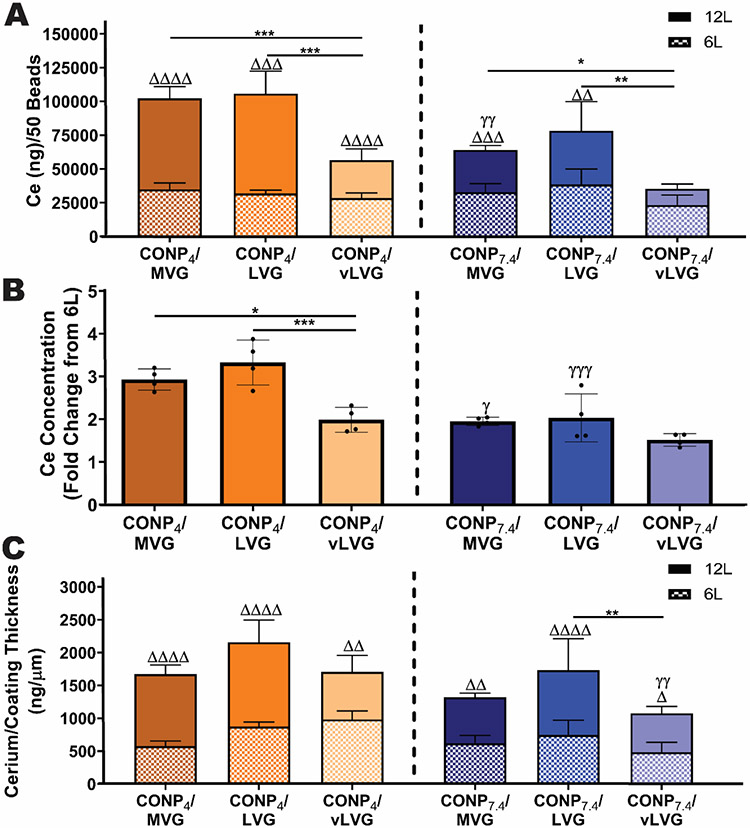
Figure 4. Deposition of CONP during CONP/alginate layer-by-layer formation was dependent on coating parameters.
A) Cerium concentration per 50 beads was quantified via ICP-MS. B) The fold change of cerium accumulation between twelve-layer from six-layer beads was quantified to the rate of CONP deposition between groups. C) The amount of cerium per micrometer of alginate-CF was calculated to understand the efficiency of cerium accumulation among groups. Two-way and one-way ANOVA with Tukey's post-hoc test: ****p < 0.0001, ***p < 0.001, **p < 0.01, and *p < 0.05, where * represents differences between groups, Δ compares six-and twelve-layer coatings, and γ compares groups with same alginate MW but varying pH of CONP.

