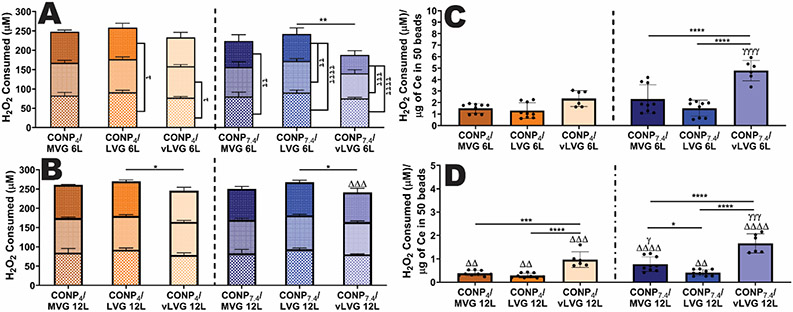
Figure 7. The H2O2 scavenging capability of CONP/alginate coatings on hydrogels was dependent on coating parameters, after repeated exposure to the exogenous H2O2.
Change in H2O2 levels following repeated exposure of 6-layer (A) and 12-layer (B) coated microbeads. Three incubation periods of distinct 100 μM H2O2 challenges are shown in three compounded bars 1st (bottom), 2nd (middle), and 3rd (top). The statistics for the sum of total H2O2 consumed after three H2O2 challenges are shown above the bars. Differences in scavenging capabilities between H2O2 challenges are represented as tau (τ), where τ τ τ τ p < 0.0001, τ τ τ p < 0.001, τ τ p < 0.01, and τ p < 0.05. The amount of H2O2 scavenged per total cerium content is shown for 6-layer (C) and 12-layer (D) beads. For all graphs, statistical differences are represented as two-way and one-way ANOVA with Tukey's post-hoc test: ****p < 0.0001, ***p < 0.001, **p < 0.01, and *p < 0.05, where * represents differences between groups, τ compares H2O2 scavenged between challenges, Δ compares six-and twelve-layer coatings, and γ compares groups with same alginate MW but varying pH of CONP.

