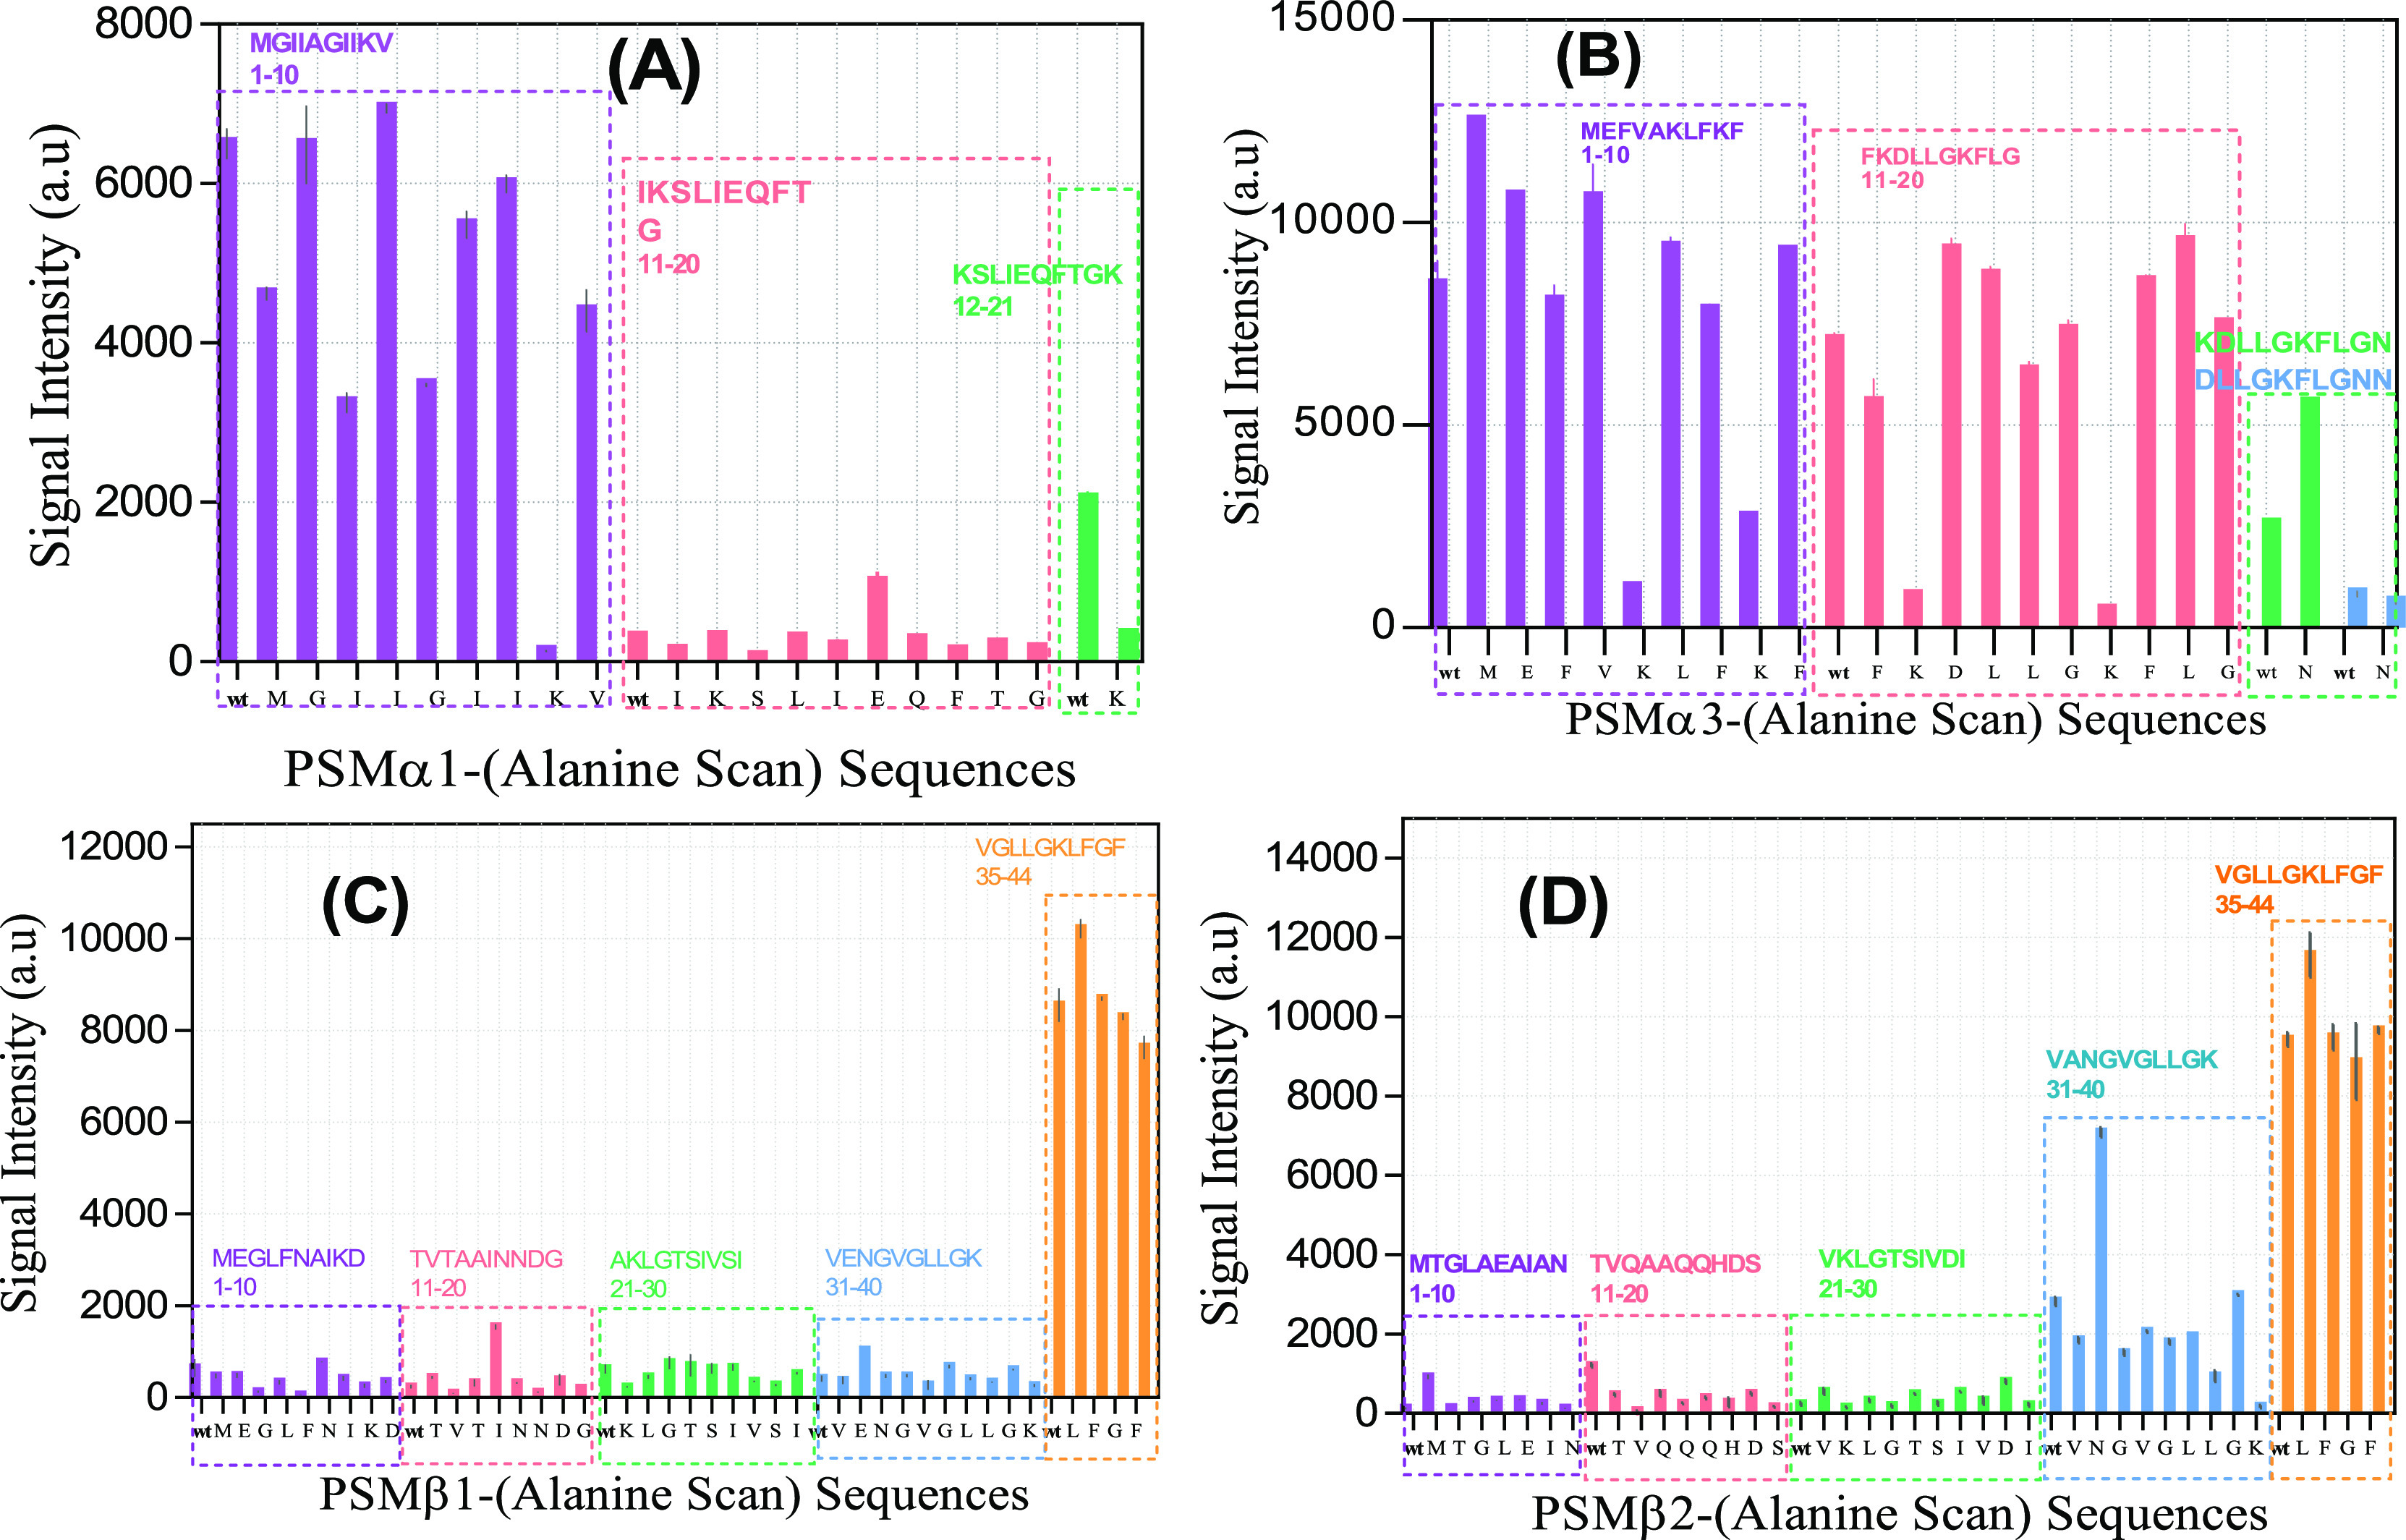
Figure 6.

Signal intensities from interaction of labeled fibrinogen with peptide-array peptides involving Ala scans of different PSMs. Signal intensity for Fg binding to sequences from (A) PSMα1, (B) PSMα3, (C) PSMβ1, and (D) PSMβ2. The peptides were divided into 10-residue peptides (each with their own color); in each peptide, positions were individually replaced by Ala from left to right. “wt” is the initial peptide before starting the Ala scan. Each letter on the x-axis shows the residue that is replaced by Ala.
