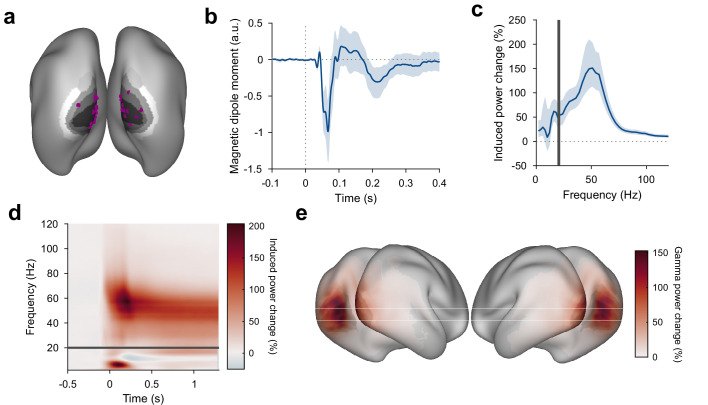
Figure 2. Stimulus-induced ERF and gamma-band response in visual cortex.
(a) Each violet dot shows the selected dipole with the strongest visually induced gamma of one subject. Black-to-white shading indicates areas V1, V2, V3, V3A, and V4. All selected dipoles were located in areas V1 or V2. All analyses referring to activity in V1/V2 used the MEG data projected into these dipoles. (b) Average V1/V2 magnetic dipole moment in response to stimulus onset. (c) Average stimulus-induced power change in V1/V2, calculated as per-trial power from 0.3 to 1.3 s post-stimulus divided by average power during the 1 s baseline. Error bars in (b, c) show 95% confidence intervals based on a bootstrap across subjects. (d) Average stimulus-induced power change in V1/V2 as a function of time and frequency. In (c, d), power values from 1 to 20 Hz (below the gray bar) were computed using Hann tapering, power values of higher frequencies were computed using multi-tapering and line noise was removed using DFT filters. (e) Average stimulus-induced gamma-power change (individual gamma peak ±10 Hz), source projected to all cortical dipoles. Values are significance-masked using a tmax-corrected permutation test. Black-to-white shading indicates areas V1, V2, V3, V3A, and V4.


