. 2021 Aug 24;10:e68240. doi: 10.7554/eLife.68240

Figure 3. Repetition effects on gamma power and peak frequency are stimulus specific.

(a) Stimulus-induced gamma power in V1/V2, on a per-trial basis. (b) Peak frequency of stimulus-induced gamma in V1/V2, on a per-trial basis. Values in (a, b) were z-scored within subjects. (c) Within-subject differences in stimulus-induced V1/V2 gamma power between the second and the first block of a given oriented grating (A2 minus A). Note that induced gamma power also showed an increase with stimulus-independent trial number, which is controlled for in the regression model presented in Results. In (a–c), the average and the 95% bootstrap confidence intervals were computed using a five-trial-wide running window. (d) Stimulus-induced power-change spectra in V1/V2 during the 120 presentations of a given stimulus, plotted in sequential 20-presentation bins. Power values from 1 to 20 Hz (left of the gray bar) were computed using Hann tapering, power values of higher frequencies were computed using multi-tapering. Line noise was removed using DFT filters. (e) Spatial distribution of the early gamma power decrease: For each cortical dipole, a regression line was fit to induced gamma power as a function of stimulus repetitions 1–10. Subject-averaged slopes (significance-masked, tmax-corrected) are shown. (f) Spatial distribution of the late gamma increase: For each cortical dipole, a regression line was fit to induced gamma power as a function of stimulus repetitions 11–120. Subject-averaged slopes (significance-masked, tmax-corrected) are shown. In (e, f), black-to-white shading indicates areas V1, V2, V3, V3A, and V4. (g) For each frequency, a linear regression across repetitions was fit to the per-trial visually induced power change in V1/V2 during the late trials (trials 11–120). Average slope and 95% bootstrap CI over subjects is shown. The corresponding analysis for the early trials (trials 1–10) is shown in Figure 3—figure supplement 1d. All results in this figure show averages over all participants.

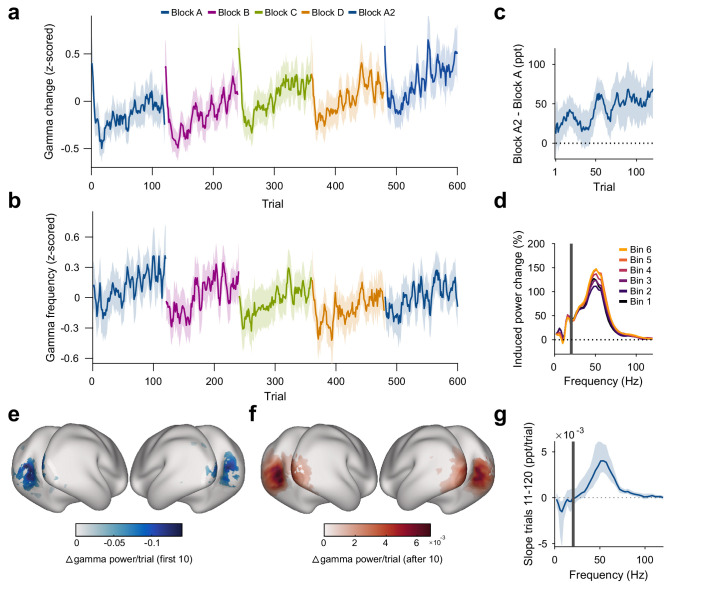
Figure 3.

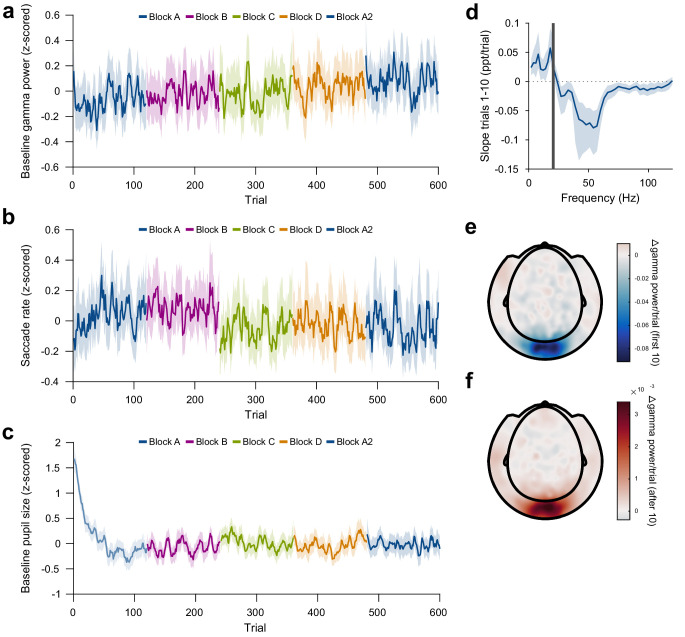
Figure 3—figure supplement 1. Control analyses of repetition-induced gamma changes.

Figure 3—figure supplement 1.

(a) Same as Figure 3a, but for gamma power in the baseline period (last second before stimulus onset). Baseline gamma power showed an increase with overall trial number, but there was no effect of stimulus-specific repetition number. (b) Same as Figure 3a, but for microsaccade rate. Microsaccade rate showed a decrease with overall trial number, but there was no effect of stimulus-specific repetition number. (c) Pupil size during the trial baseline (−0.3 to 0 s), on a per-trial basis. Baseline pupil size showed a slow decrease after the beginning of the experiment, but no changes at block boundaries. Values in (a–c) were z-scored within subjects and then averaged over subjects. (d) Same as Figure 3e, but for the early trials (trials 1–10). For each frequency, a linear regression across repetitions was fit to the per-trial visually-induced power change in V1/V2 during the early trials (trials 1–10). Average slope and 95% bootstrap CI over subjects is shown. (e) Spatial distribution of the early repetition-related gamma-power decrease: For each MEG gradiometer, a regression line was fit over stimulus repetitions 1–10. Subject-averaged slopes are shown. (f) Same as (d), but for repetitions 11–120.
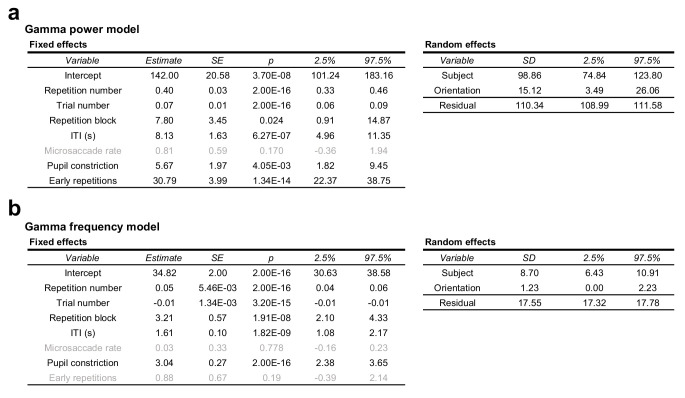
Figure 3—figure supplement 2. Full regression model of gamma power and peak-frequency changes.

Figure 3—figure supplement 2.

(a) Random intercepts linear mixed regression model describing per-trial stimulus-induced percent gamma power changes from the baseline. Grey text indicates non-significant effects. (b) Same as (a), but describing per-trial stimulus-induced gamma peak frequency. For both models, see Experimental procedures.
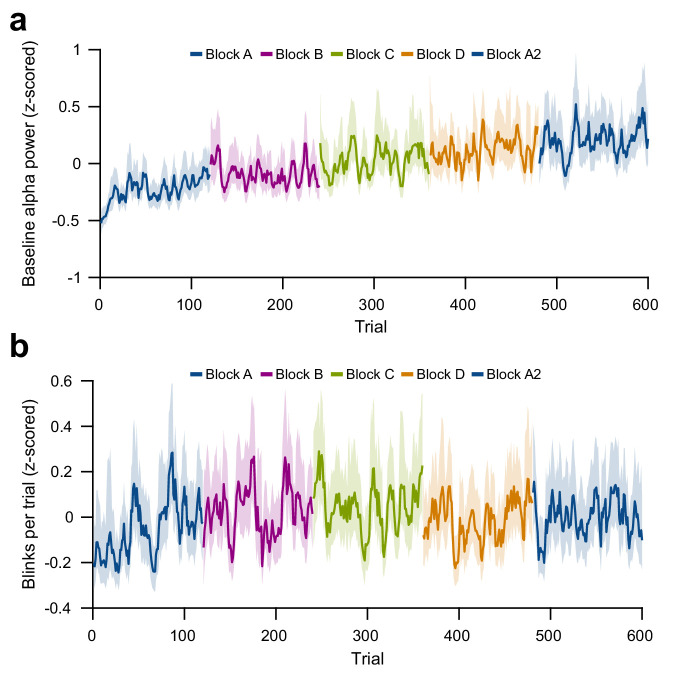
Figure 3—figure supplement 3. Per-trial changes in baseline alpha power and blink number.

Figure 3—figure supplement 3.

(a) Per-trial average alpha power during the pre-stimulus baseline interval, z-scored within subjects. (b) Per-trial number of blinks during the trial interval, on a per-trial basis, z-scored within subjects and averaged over subjects. For plots (a) and (b), average and 95% bootstrap confidence intervals were computed using a five-trial-wide running window within each block.