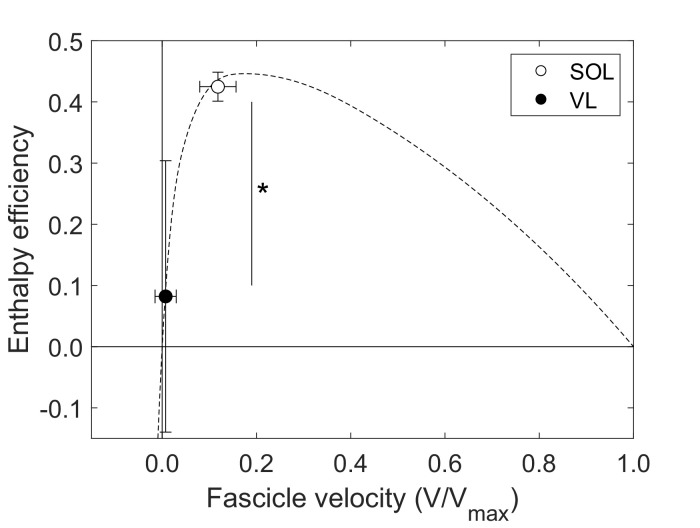
Figure 3. Soleus (SOL, n = 19) and vastus lateralis (VL, n = 14) enthalpy efficiency (mean ± SD) averaged over the stance phase of running onto the enthalpy efficiency-fascicle velocity relationship (dashed line).
*Significant difference between muscles (p<0.05).

