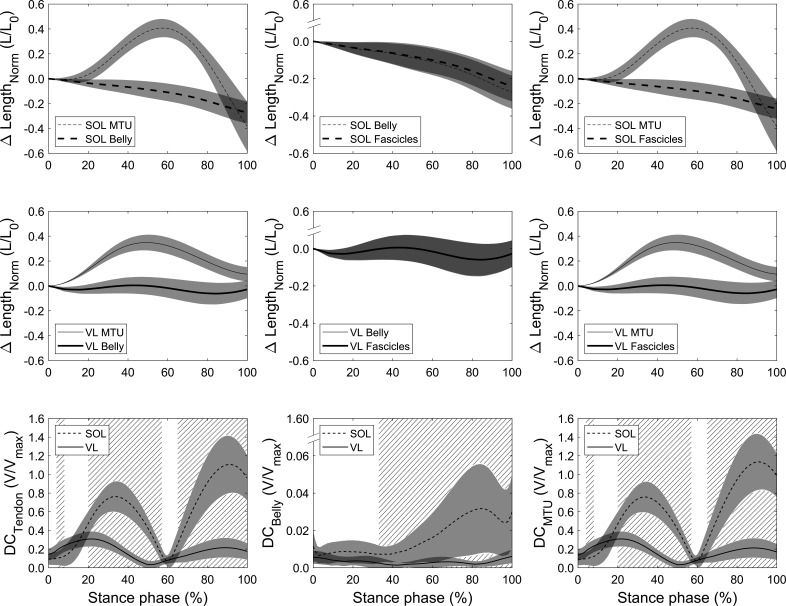
Figure 4. Soleus (SOL, n = 19, top row) and vastus lateralis (VL, n = 14, mid row) muscle-tendon unit (MTU) vs. belly length changes (left), belly vs. fascicle length changes (mid), and MTU vs. fascicle length changes (right) over the stance phase of running with respect to the length at touchdown (0% stance phase).
Differences between curves illustrate the length-decoupling due to tendon compliance, fascicle rotation, and the overall decoupling, respectively. The bottom row shows the resulting velocity-decoupling coefficients (DCs) as the absolute velocity differences between fascicles, belly, and MTU normalized to the maximum shorting velocity (see Materials and methods). Intervals of stance with a significant difference between both muscles are illustrated as hatched areas (p<0.05).

