

Abstract
Colorimetric assays typically offer a rapid and convenient method to assess analytes that span healthcare monitoring to water quality testing. However, such tests can only provide qualitative results when employed in resource-limited settings or require bulky and expensive equipment such as lab spectrophotometers to allow quantitative measurements. In this paper, we report on the use of a handheld colorimeter to quantitatively determine the concentration of analytes in a manner that is independent of ambient lighting or initial sample color. The method combines the response of the sensor with first-principles modeling that better describes the nature of the assay compared to linear-in-parameters regression modeling that is typically performed in other studies. This method was successfully demonstrated using a number of colorimetric assays: (1) determination of solution pH using a universal indicator, (2) quantification of the DNase presence using a DNA-gold nanoparticle assay, and (3) quantification of the concentration of the antibiotic tetracycline using a cell-based assay.
Introduction
Numerous colorimetric assays exist for the measurement of analytes, ranging from simple pH measurements1 to more complex assays for pesticides2−5 and pharmaceutical compounds,6,7 which can be valuable in applications such as water testing and health monitoring. The majority of such tests utilize laboratory spectrophotometry, which allows for simple development of calibration curves and consistent absorbance measurements, whereby the analyte concentration can be determined quantitatively by comparing the absorbance at wavelengths specific to the chromophore of interest to the calibration curve.
To make colorimetric assays portable, or amenable to point-of-care (POC) testing in resource-limited regions, the assay can often be adapted to function as part of a paper-based analytical device.8−15 pH and urine glucose test strips are early examples of widely available POC tests, although they require comparison of the test strip with a reference chart and thus provide only semi-quantitative estimates of the analyte concentration. Distance-based advanced paper diagnostics have been developed for more quantitative POC diagnostics,16,17 and with the arrival of increasingly advanced smartphones, substantial research has gone into the development of applications to enable the use of smartphone cameras for quantifying colorimetric assay outputs.18−22 Indeed, matching assay colors to a calibration curve is synonymous to matching paint colors, for which several smartphone applications have been developed.23
Numerous smartphone applications already exist that can utilize the RGB output from smartphone images to match a sample solution color to a predefined linear-in-parameters calibration curve, thereby allowing for measurement of the solution pH, glucose, protein, or even soil phosphorous concentration.18−22,24 However, smartphone cameras are not ideal for color measurements due to potential issues with ambient lighting25 and automated functions such as the automatic white balance, which are incorporated into the CMOS array and can skew RGB measurements.3 Furthermore, unlike spectrophotometry, such measurements lack the consistency of the calibration curve development, instead using a variety of approaches such as multiple linear regression to relate the analyte concentration to the RGB, HSV, CIELAB, or other color outputs.19−22,25
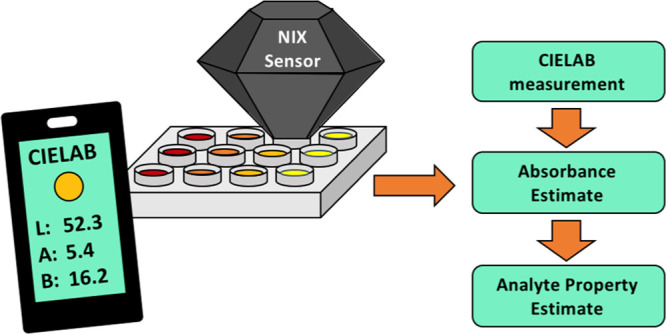
To overcome these issues, we have developed a colorimetric assay system that combines the ease-of-use and portability of POC smartphone tests with the quantitative accuracy of laboratory spectrophotometry. As shown in Scheme 1, a handheld colorimeter is used for accurate low-cost on-site measurement and is coupled with a modeling strategy that is applicable to assays involving enzymatic reactions or acid–base equilibria. The advantage of using a portable colorimeter for sample measurement is the increased accuracy and reproducibility of colorimetric measurements compared to that of smartphone image measurements, which is achieved owing to the ambient light-blocking design of the colorimeter and the internal light source that is specifically designed for accurate color quantification.26 With this strategy, first principles are used to predict the relationship between the analyte concentration and measured color, with the color output being converted to absorbance values27,28 to derive a calibration curve. The Beer–Lambert law is subsequently used to relate the calculated absorbance values to analyte concentrations. The proposed colorimetric assay method has been applied to a pH assay, governed by acid–base equilibria, as well as to enzymatic assays testing for DNase I and tetracycline concentrations in water samples.
Scheme 1. Sample Color Measurement and Analyte Concentration Modeling Method.

Experimental Section
Colorimeter
In this study, a Nix Pro color sensor was obtained from Nix Sensor Ltd., and the corresponding Nix Color Sensor Pro app was used for sample color measurements.26,29 A 1 mL capacity acetal well plate designed to match the dimensions of the colorimeter aperture was used in all measurements to permit consistent sampling of solution colors while blocking out ambient light (see the Supporting Information for dimensions).
pH Assay
The universal indicator solution used in the pH assay was prepared as described elsewhere using a mixture of methyl red, methyl orange, bromophenol blue, and phenolphthalein.30 Sample solutions ranging from pH 3 to 11 were prepared from 0.1 M HCl and NaOH stock solutions using a VWR Symphony benchtop pH meter. Tartrazine was added to sample solutions of pH 3, 5, 7, and 10 to obtain solutions with a yellow tint for the purposes of testing the effect of the initial solution color (Figure S1). In the 1 mL capacity acetal well plate, 50 μL of the universal indicator was mixed with 950 μL of the sample solution for each sample pH, and CIELAB coordinate measurements were collected using the Nix sensor. This experiment was performed in triplicate for each sample solution.
Assay to Detect DNase I Using DNA-Cross-Linked Gold Nanoparticles
The DNA-cross-linked AuNP fabrication procedure used herein is based on previous studies.31,32 100 μL of 100 μM S1 and S2 thiol-modified DNA (see Table S3 for sequences) was separately added to 3 mL of the solution of 13 nm citrate-capped gold nanoparticles (∼10 nM) with 1.9 mL of Milli-Q water added to obtain a final volume of 5.0 mL each. Following 24 h incubation at room temperature, 50 μL of Tris-HCL (1 M, pH 7.5) and 450 μL of aqueous NaCl (1 M) were added to each solution, followed by incubation at room temperature for another 24 h. 25 μL of Tris-HCL (1 M, pH 8.3) and 250 μL of aqueous NaCl (1 M) were then added to each DNA–AuNP solution, followed by a final incubation procedure at room temperature for 24 h. Each mixture was then divided into ∼550 μL volumes and centrifuged at 4 °C (14,000 rpm, ∼21,000g) for 20 min. The supernatant was discarded and replaced with 250 μL of Tris-HCl buffer (20 mM, pH 7.5) to obtain the DNA-modified AuNPs at a concentration of ∼12 nM.
DNA–cross-linked AuNP aggregates were then prepared by mixing 50 μL of S1- and S2-modified AuNPs and heating at 70 °C for 2 min, followed by overnight storage in the fridge at 4 °C. Twenty-four hours later, the DNA-cross-linked AuNP solutions were centrifuged at 14,000 rpm for 5 min, and the supernatant was removed. The resulting DNA-cross-linked AuNP pellets were used in the assays. Figure S2 in the Supporting Information shows a schematic of the assay.
The DNase I digestion assay was first performed in a transparent 96-well plate in which 100 μL of buffer solutions (20 mM Tris-HCl, pH 7.5, 10 mM MgCl2, 50 mM NaCl, and 2 mM CaCl2) of DNase I with concentrations ranging from 0.01 to 0.000625 U/μL were combined with a DNA-cross-linked AuNP pellet for digestion. A Tecan M200 plate reader was used to monitor the change in absorbance at 520 nm over a period of 60 min (Figure S3). The assay was repeated using acetal well plates for Nix CIELAB color measurements, obtained every 5 min over 25 min (this was the endpoint taken). Due to the larger acetal well plate dimensions, a larger solution volume of 300 μL was used for the Nix experiment with the same DNA-cross-linked AuNPs. In this case, 100 μL of the DNase I sample solution was added to the DNA-cross-linked AuNP pellet in a microcentrifuge tube, as for the Tecan-measured samples. After 10 min, the solution was transferred to the acetal well plate containing 200 μL of the DNase I buffer for Nix CIELAB color measurements. The experiment was performed in triplicate for each DNase I solution assessed.
Tetracycline Assay
An all-in-one field-portable assay for the detection of tetracycline in sample solutions was developed.33 The assay is based on the use of a bacterial reporter gene (denoted the microbial biosensor system—MBS). The MBS consisted of tetracycline-inducible plasmid pUT-tetlac harbored in Eschericha coli MT102 (pUT-tetlac cells)34 and was a kind gift from Dr. Søren J. Sørensen at the University of Copenhagen. The reporter cells were immobilized in paper strips (15% w/v acacia gum) to generate MBS strips (Figure 1). LB media were prepared in the form of tablets (10% w/v pullulan), and 5-bromo-4-chloro-3-indolyl β-d-galactopyranoside (X-gal) was entrapped in paper strips (7% w/v pullulan). Details on the fabrication of the all-in-one field-portable assay components are provided in the Supporting Information. These field-portable assays (Figure 1) were tested on Milli-Q water and lake water (from Bayfront Park, Hamilton, ON) spiked with tetracycline to concentrations ranging from 0 to 200 μg/L. Tubes containing 2 mL of the sample first had a pullulan tablet with LB added, followed by shaking for 2 min to fully dissolve the media. Dried reporter cell strips were then added, mixed for 20 s, and then incubated at room temperature for 1 h. At this point, the sample tube was inverted to introduce the dried X-gal strip (substrate) to the assay. The samples were incubated at room temperature for an additional hour. Samples were either transferred to a clear 96-microwell plate (100 μL aliquots) for triplicate 610 nm absorbance measurements using a TECAN M200 Infinite Pro plate reader or to the custom acetal plate (1 mL aliquots) for Nix color sensor CIELAB measurements. Data from both methods were used to generate calibration plots, from which the linearity of response and detection limits (based on 3σ of the baseline noise) were determined.
Figure 1.

Schematic of the assay design. Assay procedure involving the sequential addition of the assay components to a tube and incubation, followed by sample transfer to a custom microwell plate for color determination using the Nix color sensor. LB is Luria Bertani media. MBS is the microbial biosensor system, composed of pUT-tetlac cells immobilized in paper strips (15% w/v acacia gum).
Modeling Methods
Upon collection of the color measurements from the Nix sensor, the CIELAB coordinates were converted to RGB coordinates and input into Scott Burns’ iterative least log slope squared (ILLSS) algorithm28 to determine the associated estimated absorbance spectrum. All processing was performed using MATLAB version R2018b (MathWorks, Inc). According to Beer’s law, the absorbance at specific wavelengths is proportional to the chromophore concentration, with the wavelength of interest being dependent on the chromophore being studied. In each assay, the chromophore concentration may be related to the estimated absorbance at a specific wavelength and may also be related to the analyte concentration from first principles. Note that the background (initial) solution absorbance was subtracted from the absorbance measures in all assays to eliminate the impact of variations in the initial solution color—an important effect that was mainly investigated in the pH assay. The equations derived for the pH, DNase I, and tetracycline assays are available in the Supporting Information as eqs S1, S3, and S4, respectively.
The limit of blank (LOB) and lower limit of detection (LLOD) were calculated for the enzymatic assays following eqs 1 and 2 (see below).35 This LLOD provides a lower bound of the dynamic range of the assay. Assuming a Gaussian distribution of sample measurements, the LLOD gives the analyte concentration at which 95% of samples would be expected to yield measurements above the LOB, which gives the value below which 95% of the “zero” concentration measurements would fall.
| 1 |
| 2 |
Similarly, the upper limit of detection (ULOD) can be defined as the value of the 95% lower confidence bound at saturation for the purposes of the enzymatic assays presented in this work. This value can be determined upon calibration curve fitting and provides the upper limit of the dynamic range of the assay.
Results and Discussion
pH Assay
The pH assay is based on the combination of multiple indicators present in the universal indicator solution, and hence, the color varies from orange to purple across the pH range (Figure 2A). For the construction of calibration curves, the summed absorbances in the 500–550 nm range (Figure 2B) and the 550–600 nm range (Figure 2C) were modeled. Given the sample absorbance500–550 and absorbance550–600 measurements, pH predictions were obtained by minimizing the sum of squared residuals from the two calibration curves. As shown in Figure 2D, the predictions for the colorless solutions are fairly accurate, with R2 = 0.984, while the predictions for the yellow-dyed solutions are slightly less accurate but still strongly correlated, with R2 = 0.884. In this case, the ability to subtract the initial solution absorbance from the final absorbance with an indicator is crucial for accurate prediction. While a traditional CIELAB linear-in-parameters regression model (shown in Figure 2E) can be used to accurately predict the solution pH of colorless solutions following calibration curve fitting (R2 = 0.998) as performed in other studies,20 such a model is unable to account for varying initial solution colors. The pH predictions of the yellow solutions using the CIELAB linear-in-parameters regression model show significant deviation from the actual pH (R2 = 0.749). This demonstrates the advantages of the absorbance-based model with background subtraction in applications where the initial solution color may vary and must be considered for the assay. Model parameters for both the first-principles absorbance model and the CIELAB linear-in-parameters regression model are provided in the Supporting Information.
Figure 2.

(A) Sample solutions ranging from pH 3 to 11 in the acetal well plate. Summed absorbance in the (B) 500–550 and (C) 550–600 nm ranges as a function of solution pH. (D) Predicted vs actual solution pH for colorless and yellow-dyed sample solutions using calibration curves from (B,C) and (E) predicted vs actual solution pH using a basis function regression. Error bars represent the standard error.
For the DNase I assay using DNA-cross-linked gold nanoparticles, it is known that the color of AuNP solutions is strongly dependent on the AuNP interparticle distance.31,32 When DNA-cross-linked AuNPs are aggregated together at interparticle distances <2.5 times the particle diameter, they produce a dark blue–black color31 or a colorless solution if the AuNPs precipitate. The addition of DNase I leads to disaggregation of the nanoparticles due to the digestion of the cross-linking DNA, resulting in a change of the color of the solution from dark blue to red or from colorless to red with the maximum absorbance at approximately 520 nm for 13 nm size gold nanoparticles (see Figure S2 in the Supporting Information).
Figure 3A shows the sample solutions in the acetal well plates as a function of DNase I concentration, indicating a transition from colorless to deep red. Taking the estimated absorbance at 520 nm from the Nix sensor measurements for a range of DNase I concentrations (6.25 × 10⁻⁴ to 2 × 10⁻² U/μL) after 25 min incubation, a sigmoidal trend of the change in 520 nm absorbance is clearly visible across the range of DNase I concentrations studied (Figure 3B). Applying eq S4, the data can be fit with a sigmoid curve with R2 = 0.975 (see the Supporting Information for model parameters).
Figure 3.

(A) Sample solutions in the acetal well plate ranging from 0.0 to 0.02 U/μL after 10 min. (B) Change in absorbance at 520 nm, measured by the Nix sensor after 25 min and (C) actual vs predicted DNase I concentration. Error bars represent the standard error from triplicate experiments. The blue-highlighted regions indicate the LLOD and ULOD bounds, while the green region indicates the prediction area within the dynamic range of the assay.
The DNase I concentration in each sample can then be approximated by applying the inverse sigmoid function to generate a linear response, as shown in Figure 3C (R2 = 0.943 in the concentration range from 1.25 × 10⁻³ to 0.01 U/μL). This model suggests that for an incubation time of 25 min, the LLOD is approximately 1.50 × 10⁻³ U/μL. A similar trend is observed when using a Tecan plate reader to obtain absorbance measurements at 25 min incubation for DNase I concentrations ranging from 6.25 × 10⁻⁴ to 0.01 U/μL (Figure S3, R2 = 0.9996). The LLOD for the plate reader measurements (1.26 × 10⁻³ U/μL) is relatively consistent with that from the Nix sensor, although the dynamic range obtained from the plate reader is slightly larger (Figure S3 in the Supporting Information).
Tetracycline Assay
As explained in the Modeling Methods in the Experimental Section, the production of β-galactosidase in tetracycline-inducible pUT-tetlac E. coli cells is directly related to the bioavailable concentration of tetracycline in the environment. As a result, the cleavage of X-gal by β-galactosidase, which can be monitored by the absorbance at 610 nm, may be related back to the bioavailable tetracycline concentration. Estimated absorbance measurements derived both from the Nix CIELAB color measurements and plate reader absorbance measurements were obtained for both Milli-Q water and lake water samples spiked with 0–200 μg/L tetracycline. Comparing the lake water and Milli-Q water samples as well as the Nix measurements and plate reader measurements, similar absorbance trends and therefore calibration curves are obtained, as shown in Figure 4. It is notable that the Nix measurements better fit the model defined in eq S12 (R2 = 0.943 and 0.957 for the Milli-Q and lake water curves, respectively) compared to the plate reader measurements (R2 = 0.827 and 0.870, respectively). Model parameters are given in the Supporting Information. In both data sets, the change in absorbance values span 0.0 au to approximately 0.12 au for the range of tetracycline solutions studied; however, the trend observed with the Nix sensor measurements appear to show a much smoother color progression fitting the defined model than that fitting the plate reader data. In both cases, saturation occurs for tetracycline concentrations exceeding 75 μg/L, at which point the absorbance at 610 nm approaches a maximum. This may be, in part, due to the substantial killing of the reporter cells at tetracycline concentrations exceeding 75 μg/L, which effectively limits the dynamic range of the assay. The dynamic ranges determined for each assay are presented in Table 1.
Figure 4.

Absorbance at 610 nm determined by Nix sensor measurements for (A) Milli-Q water samples and (B) lake water samples and 610 nm TECAN M200 Infinite Pro absorbance measurements for the (C) Milli-Q water and (D) lake water samples. All data alongside the calibration curve generated using the MATLAB Curve Fitting Tool and eq S12. Predicted vs actual tetracycline concentration graphs are shown in (E,F) for the Nix (E) Milli-Q and (F) lake water measurements and the TECAN (G) Milli-Q and (H) lake water measurements. Error bars represent the standard error, while the blue-highlighted regions indicate the LLOD and ULOD bounds, and the green regions indicate the prediction area within the dynamic range of the assay. (I) Sample lake water solutions following Nix color measurement in the acetal well plate.
Table 1. Tetracycline Assay Dynamic Ranges for Each Measurement Set (Nix vs Plate Reader Measurements and Milli-Q Water vs Lake Water Samples).
| Reader | Nix Color Sensor |
TECAN Infinite 200 Pro Plate Reader |
||
|---|---|---|---|---|
| Water | Milli-Q | Lake | Milli-Q | Lake |
| LLOD (μg/L) | 8.2 | 8.8 | 6.9 | 3.4 |
| ULOD (μg/L) | 30.8 | 52.7 | 20.6 | 47.2 |
The Nix assays presented have both higher LLODs and ULODs than the plate reader assays. In all cases, however, predicted tetracycline concentrations based off the calibration curves significantly differ from actual values at concentrations above 50 μg/L due to measurement saturation and noise, as shown in Figure 4. For the enzymatic assays, variations in the detection window when comparing the Nix measurements and Tecan plate reader measurements are thought to arise due to the difference in sample size, sensor, and absorbance measurement procedure. While the limits of detection are quite narrow in the assays studied, it is worthwhile to mention that adjustments to the assay protocols, such as the incubation time in the enzymatic assays, can be implemented to shift the detection window as desired.
In all the aforementioned colorimetric assays, color data obtained using a handheld colorimeter (Nix sensor) through the colorimeter’s smartphone application were exported to a .csv file for analysis in MATLAB on a laptop computer. However, to make these assays fully portable, this measurement and analysis process can be integrated into a simple smartphone app. This one-step measurement and analysis app would not only maintain the simplicity of colorimetric assays but would offer a low-cost, accessible, user-friendly, and highly portable tool for a myriad of applications from at-home healthcare monitoring to on-site food and water quality testing. User interface examples of a proof-of-concept smartphone app developed using XCode 10.1 for Apple iPhone application development are provided in the Supporting Information (Figure S7).
As with any colorimetric assay, recalibration would be recommended when conditions such as temperature or indicator formulation change, which may impact the assay response. However, variations in ambient lighting conditions which necessitate frequent curve recalibration in smartphone image-based assays are not of concern with the use of the Nix sensor thanks to its ambient light-blocking design and internal light source that enable accurate and reproducible color quantification.26
Conclusions
Colorimetric assays typically offer fast and simple testing of a variety of analyte properties, with the drawback of either producing semi-qualitative results that must be interpreted by eye or requiring a bulky and expensive spectrophotometer for accurate measurements and predictions. The use of a colorimeter and a first-principles modeling methodology provides a foundation for the accurate prediction of analyte properties from colorimetric assays. Such a system brings together the accuracy of a bench-top spectrophotometer with the simplicity and affordability of POC colorimetric assays. Having applied this methodology to three colorimetric assays—more specifically, pH, DNA-AuNP, and tetracycline assays—the results demonstrate that the assays and calibration curve modeling are effective for a variety of assays following different mechanistic models. Moreover, this methodology shows promising results for both acid–base equilibria and enzymatic assays, with the reliability maintained despite the varying initial solution colors in the case of the pH assay or complex media in the case of the tetracycline assay.
Previous studies have typically used smartphone cameras for imaging and linear-in-parameters regression for calibration curve fitting for numerous assays. While our method requires the use of an inexpensive colorimeter, the colorimeter offers more accurate color measurement than a smartphone camera,34 and the first-principles modeling provides a more consistent foundation for modeling a variety of assays than the variable linear-in-parameters regression models uniquely structured for particular assays. Through integration of the data analysis algorithms performed on MATLAB in this study into a smartphone application that would interpret the colorimeter’s color data, this measurement and modeling strategy would truly represent a portable and cost-effective prediction tool for numerous colorimetric assays.
Acknowledgments
The authors thank the Natural Sciences and Engineering Research Council of Canada and the Ontario Research Fund Grant for funding. We also thank the Canadian Foundation for Innovation and the Ontario Ministry of Research and Innovation for Infrastructure funding to the Biointerfaces Institute. J.D.B. holds the Canada Research Chair in Point-of-Care Diagnostics. We thank Nix for providing us the sensor used in this work.
Supporting Information Available
The Supporting Information is available free of charge at https://pubs.acs.org/doi/10.1021/acsomega.1c03460.
Outline of the model structure and parameters for each of the colorimetric assays discussed (PDF)
Author Contributions
K.A., E.M.S.-H., D.W., Monsur Ali, N.R.A., V.L., Muntakim Ali, and M.S. performed the experiments. K.A., N.R.A., A.C., J.D.B., J.N., and C.D.M.F. conceived the study. K.A., Muntakim Ali, N.R.A., J.D.B., J.N., and C.D.M.F. wrote the manuscript. All authors have given approval to the final version of the manuscript.
The authors declare no competing financial interest.
Supplementary Material
References
- Bates R. G.; Vijh A. K. Determination of pH: Theory and Practice. J. Electrochem. Soc. 1973, 120, 263C. 10.1149/1.2403829. [DOI] [Google Scholar]
- Lemos V. A.; de Carvalho A. L. Determination of cadmium and lead in human biological samples by spectrometric techniques: a review. Environ. Monit. Assess. 2010, 171, 255–265. 10.1007/s10661-009-1276-z. [DOI] [PubMed] [Google Scholar]
- Ellman G. L.; Courtney K. D.; Andres V. Jr.; Featherstone R. M. A new and rapid colorimetric determination of acetylcholinesterase activity. Biochem. Pharmacol. 1961, 7, 88–95. 10.1016/0006-2952(61)90145-9. [DOI] [PubMed] [Google Scholar]
- Kramer D. N.; Gamson R. M. Colorimetric Determination of Acetylcholinesterase Activity. Anal. Chem. 1958, 30, 251–254. 10.1021/ac60134a026. [DOI] [Google Scholar]
- Che Sulaiman I. S.; Chieng B. W.; Osman M. J.; Ong K. K.; Rashid J. I. A.; Wan Yunus W. M. Z.; Noor S. A. M.; Kasim N. A. M.; Halim N. A.; Mohamad A. A review on colorimetric methods for determination of organophosphate pesticides using gold and silver nanoparticles. Microchim. Acta 2020, 187, 131. 10.1007/s00604-019-3893-8. [DOI] [PubMed] [Google Scholar]
- Sanyal A. K.; Laha D. Rapid colorimetric assay of trimethoprim and sulfamethoxazole in pharmaceuticals. J. Assoc. Off. Anal. Chem. 1983, 66, 1447–1449. 10.1093/jaoac/66.6.1447. [DOI] [PubMed] [Google Scholar]
- Saleh H.; Schnekenburger J. Colorimetric method for the quantitative determination of the antibilharzial drug praziquantel and its application to pharmaceutical preparations. Analyst 1992, 117, 87–92. 10.1039/an9921700087. [DOI] [PubMed] [Google Scholar]
- Ozer T.; McMahon C.; Henry C. S. Advances in Paper-Based Analytical Devices. Annu. Rev. Anal. Chem. 2020, 13, 85. 10.1146/annurev-anchem-061318-114845. [DOI] [PubMed] [Google Scholar]
- Cate D. M.; Adkins J. A.; Mettakoonpitak J.; Henry C. S. Recent Developments in Paper-Based Microfluidic Devices. Anal. Chem. 2015, 87, 19–41. 10.1021/ac503968p. [DOI] [PubMed] [Google Scholar]
- Dungchai W.; Chailapakul O.; Henry C. S. Use of multiple colorimetric indicators for paper-based microfluidic devices. Anal. Chim. Acta 2010, 674, 227–233. 10.1016/j.aca.2010.06.019. [DOI] [PubMed] [Google Scholar]
- Hossain S. M. Z.; Luckham R. E.; Smith A. M.; Lebert J. M.; Davies L. M.; Pelton R. H.; Filipe C. D. M.; Brennan J. D. Development of a Bioactive Paper Sensor for Detection of Neurotoxins Using Piezoelectric Inkjet Printing of Sol–Gel-Derived Bioinks. Anal. Chem. 2009, 81, 5474–5483. 10.1021/ac900660p. [DOI] [PubMed] [Google Scholar]
- Yager P.; Edwards T.; Fu E.; Helton K.; Nelson K.; Tam M. R.; Weigl B. H. Microfluidic diagnostic technologies for global public health. Nature 2006, 442, 412–418. 10.1038/nature05064. [DOI] [PubMed] [Google Scholar]
- Martinez A. W.; Phillips S. T.; Whitesides G. M.; Carrilho E. Diagnostics for the Developing World: Microfluidic Paper-Based Analytical Devices. Anal. Chem. 2010, 82, 3–10. 10.1021/ac9013989. [DOI] [PubMed] [Google Scholar]
- Liu X.; Mwangi M.; Li X.; O’Brien M.; Whitesides G. M. Paper-based piezoresistive MEMS sensors. Lab Chip 2011, 11, 2189–2196. 10.1039/c1lc20161a. [DOI] [PubMed] [Google Scholar]
- Pelton R. Bioactive paper provides a low-cost platform for diagnostics. TrAC, Trends Anal. Chem. 2009, 28, 925–942. 10.1016/j.trac.2009.05.005. [DOI] [PMC free article] [PubMed] [Google Scholar]
- Cate D. M.; Noblitt S. D.; Volckens J.; Henry C. S. Multiplexed paper analytical device for quantification of metals using distance-based detection. Lab Chip 2015, 15, 2808–2818. 10.1039/c5lc00364d. [DOI] [PMC free article] [PubMed] [Google Scholar]
- Yamada K.; Citterio D.; Henry C. S. “Dip-and-read” paper-based analytical devices using distance-based detection with color screening. Lab Chip 2018, 18, 1485–1493. 10.1039/c8lc00168e. [DOI] [PMC free article] [PubMed] [Google Scholar]
- Yetisen A. K.; Martinez-Hurtado J. L.; Garcia-Melendrez A.; da Cruz Vasconcellos F.; Lowe C. R. A smartphone algorithm with inter-phone repeatability for the analysis of colorimetric tests. Sens. Actuators, B 2014, 196, 156–160. 10.1016/j.snb.2014.01.077. [DOI] [Google Scholar]
- Morais C. L. M.; Neves A. C. O.; Menezes F. G.; Lima K. M. G. Determination of serum protein content using cell phone image analysis. Anal. Methods 2016, 8, 6458–6462. 10.1039/c6ay01783e. [DOI] [Google Scholar]
- Shen L.; Hagen J. A.; Papautsky I. Point-of-care colorimetric detection with a smartphone. Lab Chip 2012, 12, 4240–4243. 10.1039/c2lc40741h. [DOI] [PubMed] [Google Scholar]
- Gee C. T.; Kehoe E.; Pomerantz W. C. K.; Penn R. L. Quantifying Protein Concentrations Using Smartphone Colorimetry: A New Method for an Established Test. J. Chem. Educ. 2017, 94, 941–945. 10.1021/acs.jchemed.6b00676. [DOI] [PMC free article] [PubMed] [Google Scholar]
- Kim S. D.; Koo Y.; Yun Y. A Smartphone-Based Automatic Measurement Method for Colorimetric pH Detection Using a Color Adaptation Algorithm. Sensors 2017, 17, 1604. 10.3390/s17071604. [DOI] [PMC free article] [PubMed] [Google Scholar]
- Sherwin-Williams ColorSnap® Visualizer for iPhone and Android. https://www.sherwin-williams.com/homeowners/color/try-on-colors/colorsnap-mobile (accessed August 17, 2018).
- Moonrungsee N.; Pencharee S.; Jakmunee J. Colorimetric analyzer based on mobile phone camera for determination of available phosphorus in soil. Talanta 2015, 136, 204–209. 10.1016/j.talanta.2015.01.024. [DOI] [PubMed] [Google Scholar]
- Sicard C.; Glen C.; Aubie B.; Wallace D.; Jahanshahi-Anbuhi S.; Pennings K.; Daigger G. T.; Pelton R.; Brennan J. D.; Filipe C. D. M. Tools for water quality monitoring and mapping using paper-based sensors and cell phones. Water Res. 2015, 70, 360–369. 10.1016/j.watres.2014.12.005. [DOI] [PubMed] [Google Scholar]
- Nix Color Sensor. Nix Pro. https://www.nixsensor.com/nix-pro/ (accessed August 17, 2018).
- Christodouleas D. C.; Nemiroski A.; Kumar A. A.; Whitesides G. M. Broadly Available Imaging Devices Enable High-Quality Low-Cost Photometry. Anal. Chem. 2015, 87, 9170–9178. 10.1021/acs.analchem.5b01612. [DOI] [PubMed] [Google Scholar]
- Burns S. A.Subtractive Color Mixture Computation. http://scottburns.us/subtractive-color-mixture/ (accessed August 17, 2018).
- Apple_Inc. Nix Pro Color Sensor on the App Store. https://itunes.apple.com/ca/app/nix-pro-color-sensor/id970299887?mt=8 (accessed August 17, 2018).
- Perkins R.Preparation of a Universal Indicator. www.bcscta.ca/resources/hebden/chem/Universal%20Indicator%20Prep.doc (accessed August 17, 2018).
- Zhao W.; Ali M. M.; Aguirre S. D.; Brook M. A.; Li Y. Paper-Based Bioassays Using Gold Nanoparticle Colorimetric Probes. Anal. Chem. 2008, 80, 8431–8437. 10.1021/ac801008q. [DOI] [PubMed] [Google Scholar]
- Xu X.; Han M. S.; Mirkin C. A. A Gold-Nanoparticle-Based Real-Time Colorimetric Screening Method for Endonuclease Activity and Inhibition. Angew. Chem., Int. Ed. 2007, 46, 3468–3470. 10.1002/anie.200605249. [DOI] [PubMed] [Google Scholar]
- Salvo E. M.The Air-Drying of Escherichia coli Reporters in Natural Polymers and Incorporation into Simple Bioassays; McMaster University: Hamilton, 2017. [Google Scholar]
- Hansen L. H.; Sørensen S. r. J. Detection and quantification of tetracyclines by whole cell biosensors. FEMS Microbiol. Lett. 2000, 190, 273–278. 10.1111/j.1574-6968.2000.tb09298.x. [DOI] [PubMed] [Google Scholar]
- Armbruster D. A.; Pry T. Limit of blank, limit of detection and limit of quantitation. Clin. Biochem. Rev. 2008, 29, S49–S52. [PMC free article] [PubMed] [Google Scholar]
Associated Data
This section collects any data citations, data availability statements, or supplementary materials included in this article.