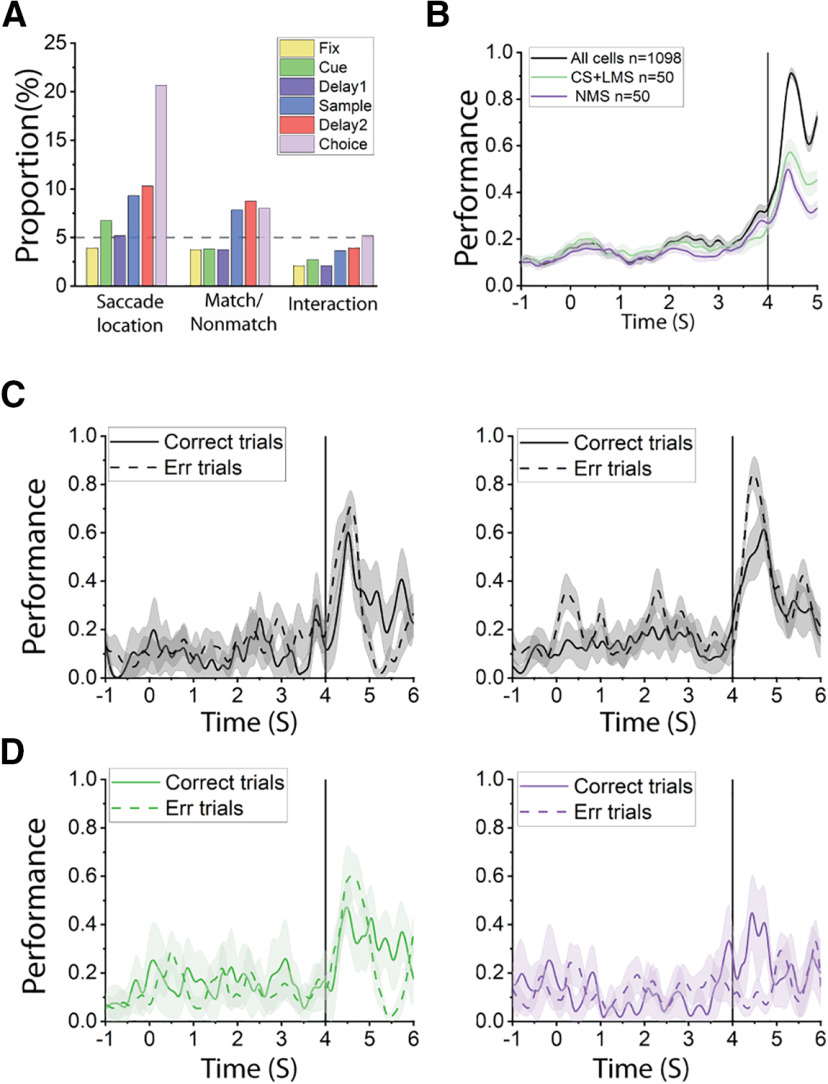
Figure 11.
A, Bar graphs represent the proportions of cells tuned to saccade location, matching status, and their interaction (i.e., NMS) in different stages of the task trials, for the active spatial task. B, Decoding of saccadic direction using all recorded cells, or the same number of CS+LMS/NMS cells in the active spatial tasks. Time 0 at the x axis indicted the onset of the cue. Black line indicates onset of choice array. C, Saccadic direction decoding was equally effective in correct and error trials, regardless of pseudo-population size. Left, Decoding saccadic direction using 239 cells with 4 randomly selected correct and error trials (2 trials in 2 the same 2 conditions are randomly selected, thus resulting in 4 trials for each cell; condition was defined by saccade location × matching status). Right, Decoding saccadic direction using 155 cells with 2 correct and error trials in the same conditions. D, Decoding saccadic direction using different populations from the same cells in C. Left, Decoding performance using 54 CS+LMS cells with 4 correct and error trials. Right, Decoding performance using 10 NMS cells with 4 correct and error trials. In all panels, the shaded range represents 95% CI for 10 randomly constructed pseudo-populations. Time point 0 is the onset of cue. Black line at 4 s indicates the onset of the choice array.

