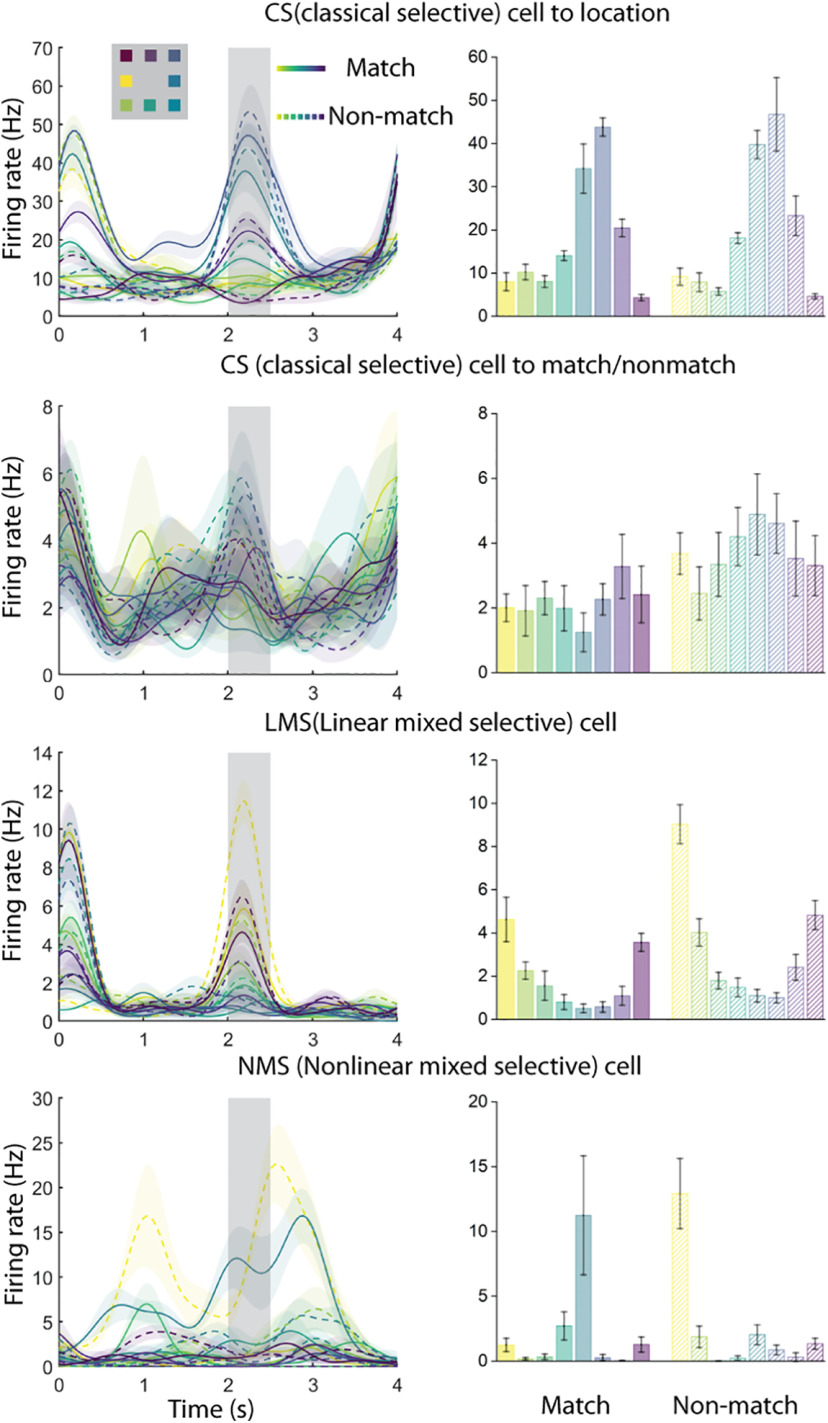
Figure 2.
Exemplar neural responses from the spatial task for CS, LMS, and NMS cells, defined by the task variables of stimulus location and match status. Selectivity classification was based on the spike responses of the 500 ms sample period (indicated by the gray shaded area from 2 to 2.5 s). The locations of the stimuli were color-coded. Solid line represents the stimulus when it was a match. Dashed line represents the stimulus when it was a nonmatch. Shaded regions and error bars represent ±SE of firing rate.

