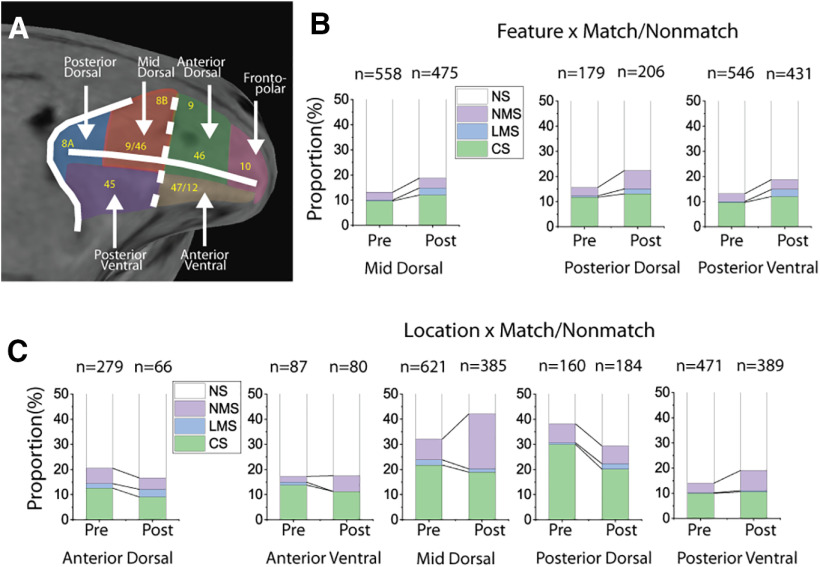
Figure 5.
Cell selectivity changes by brain regions. A, PFC subdivisions that were used for recording in the current study. B, The effects of training in the active feature task on the proportion of different selectivity categories (NS, CS, LMS, and NMS) in the sample period. There were significant increases in the proportion of LMS cells in all three PFC regions included for analysis, but relatively low increases in the proportion of NMS cells. C, The effects of training in the active spatial task on the proportion of different selectivity categories (NS, CS, LMS, and NMS) in the sample period. The greatest increase in NMS occurred at the mid-dorsal region.

