
Figure 1.
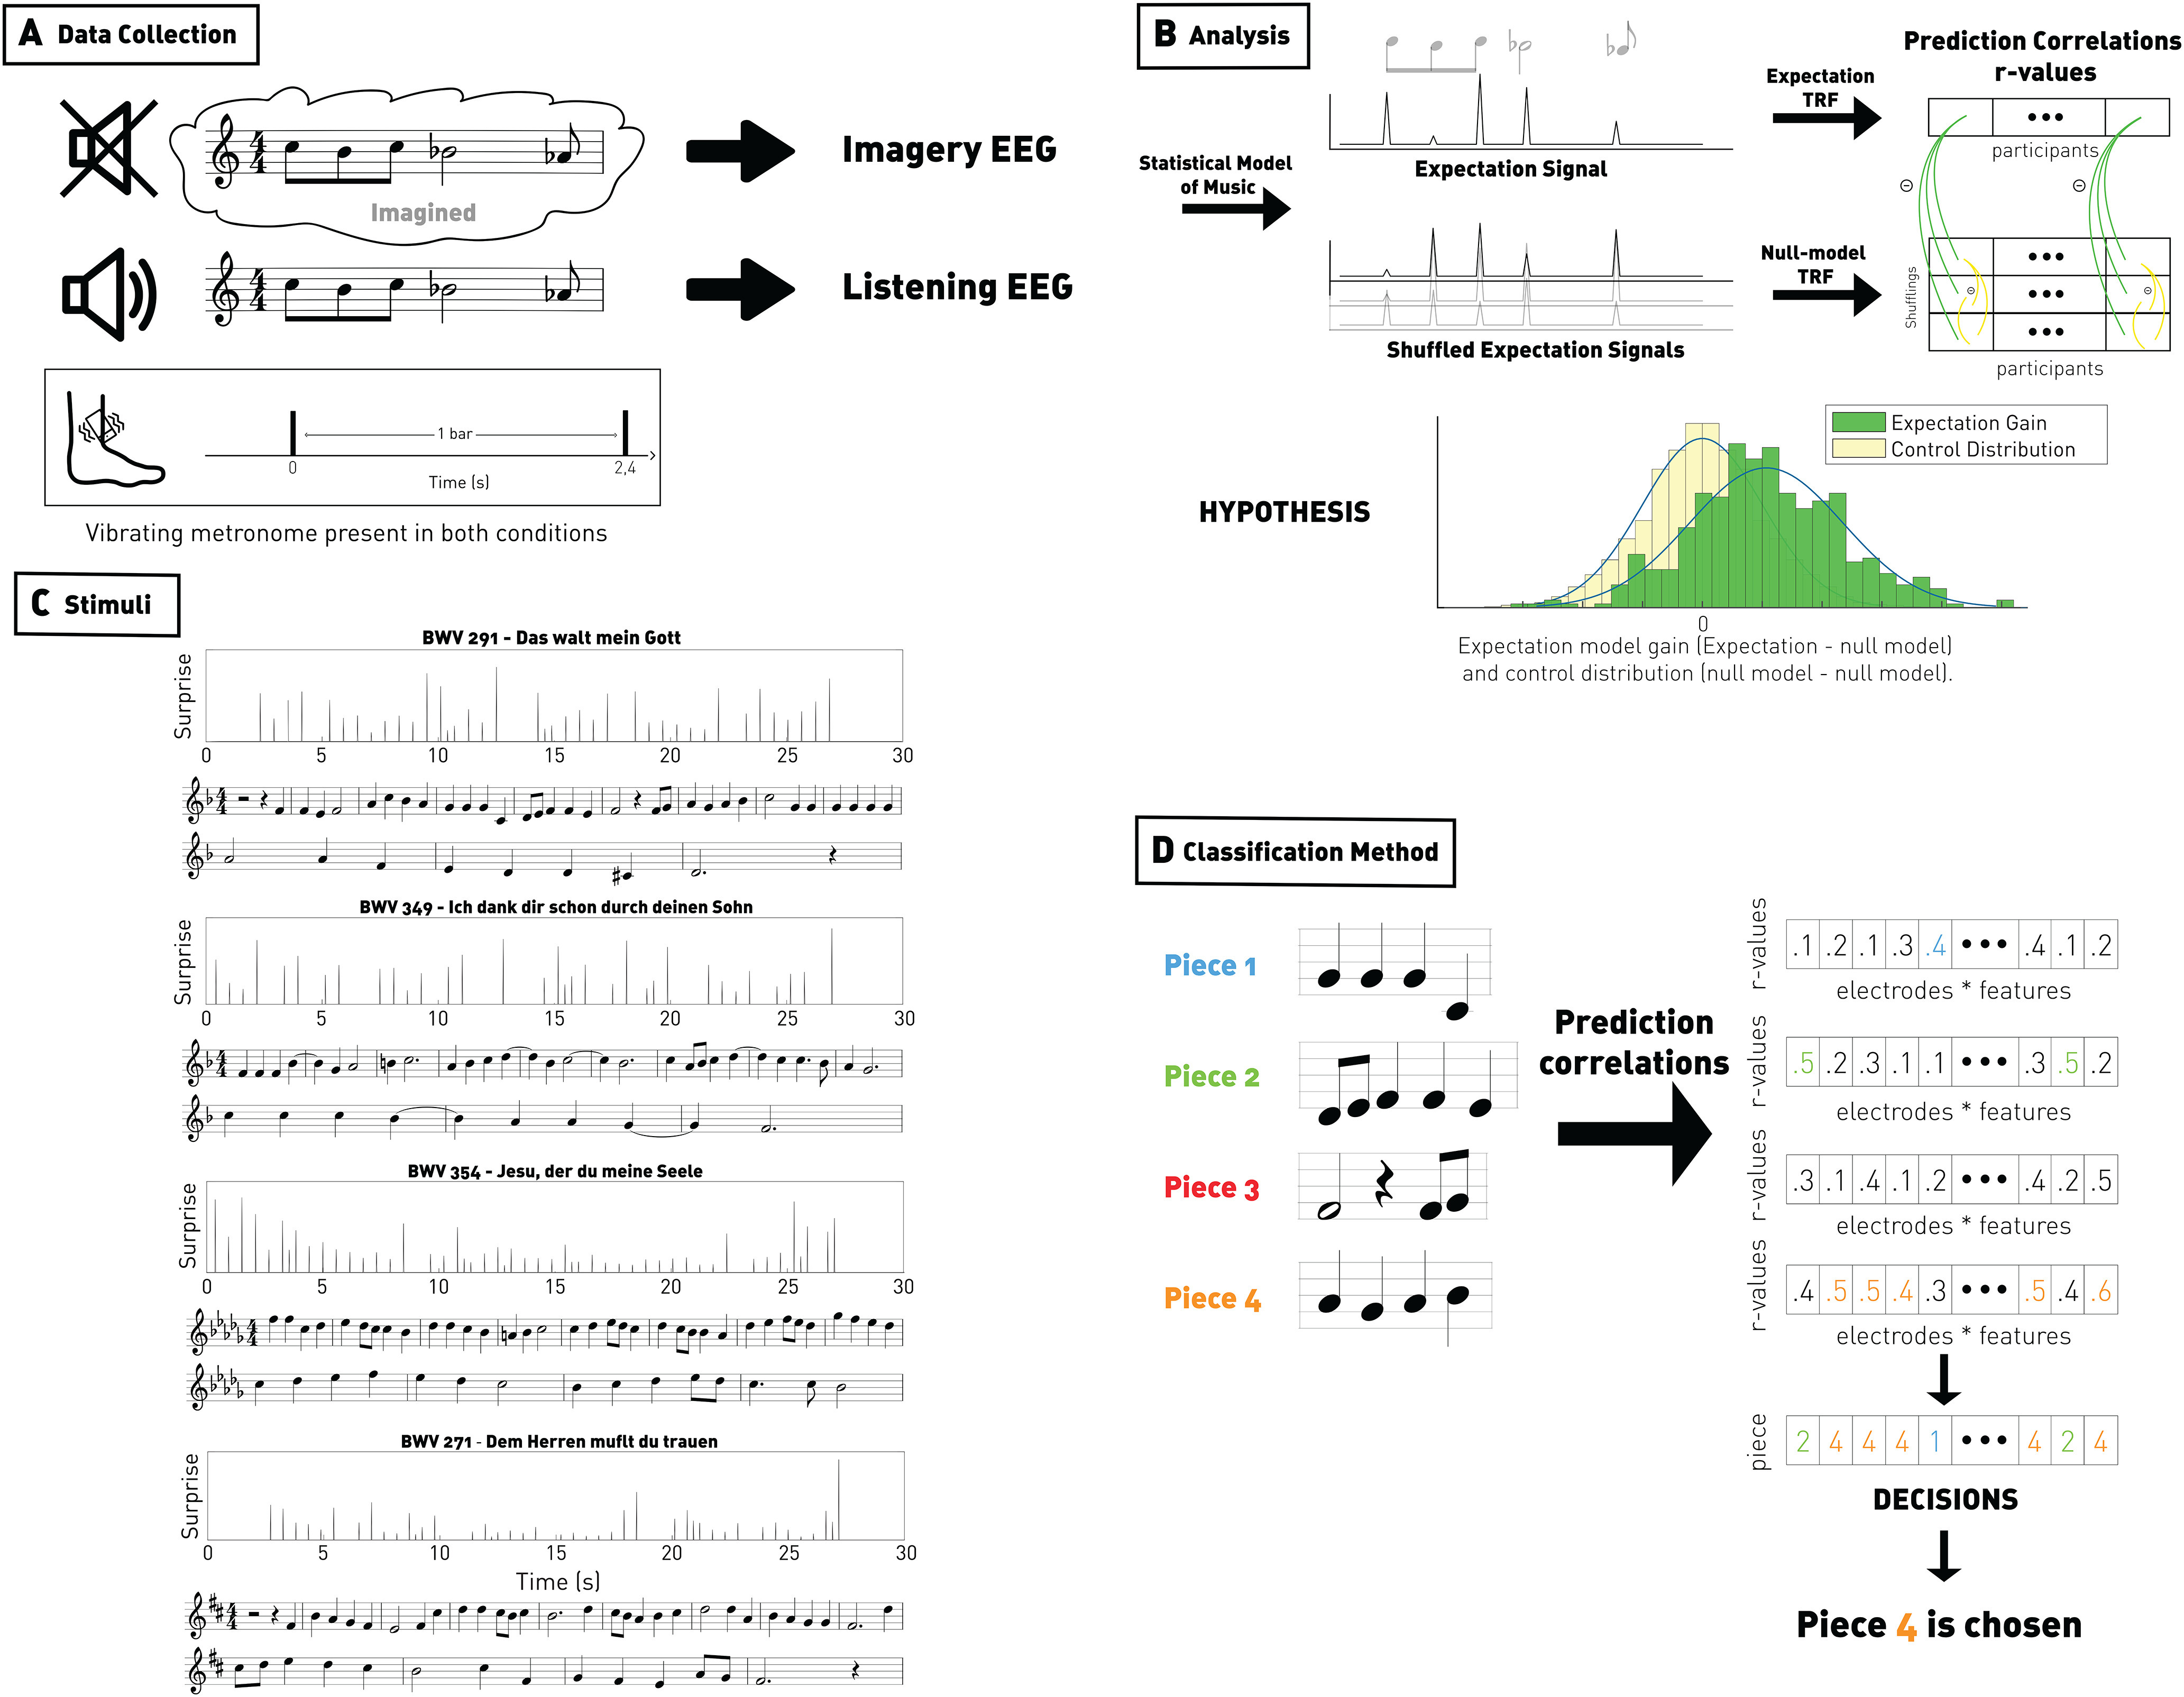
Method figure. A, EEG signal was recorded from participants who listened to and imagined four monophonic Bach melodies. The musical bars were indicated using a vibrotactile metronome. B, Top left panels, Onset vector amplitude modulated according to a statistical model of musical expectations. Null model distributions were derived by shuffling the expectation values while preserving the note onsets. Top right, Forward TRFs were estimated between the melody vectors and the EEG signal. EEG prediction correlations were derived based on the stimulus vectors and subtracted by the ones for the shuffled vectors, providing (Expectation gain; green), reflecting the EEG encoding of melodic expectations. A control distribution was derived by subtracting EEG prediction correlations between pairs of shuffled vectors (yellow). Bottom, We hypothesized a positive shift in expectation gain (green distribution) relative to the control distribution (yellow distribution). C, Stimuli. Musical scores and expectation vectors for each of the four Bach choral stimuli. Melodies were presented at 100 bpm (∼30 s each). The expectation signal was computed for each of the melodies using IDyOM. The information content value of each note (the negative log likelihood) was used to modulate the note onset values. Forward TRF models were then fit between the resulting vectors and the EEG signal. D, Classification method. We trained a TRF model with leave-one-out cross-validation and used this model to predict, from the four candidate pieces, the target EEG. We therefore have nb_electrodes × nb_features prediction correlations. For each of these estimators, we assess which piece maximizes the correlation, and the final decision is the piece that occurs the most across electrodes and features.