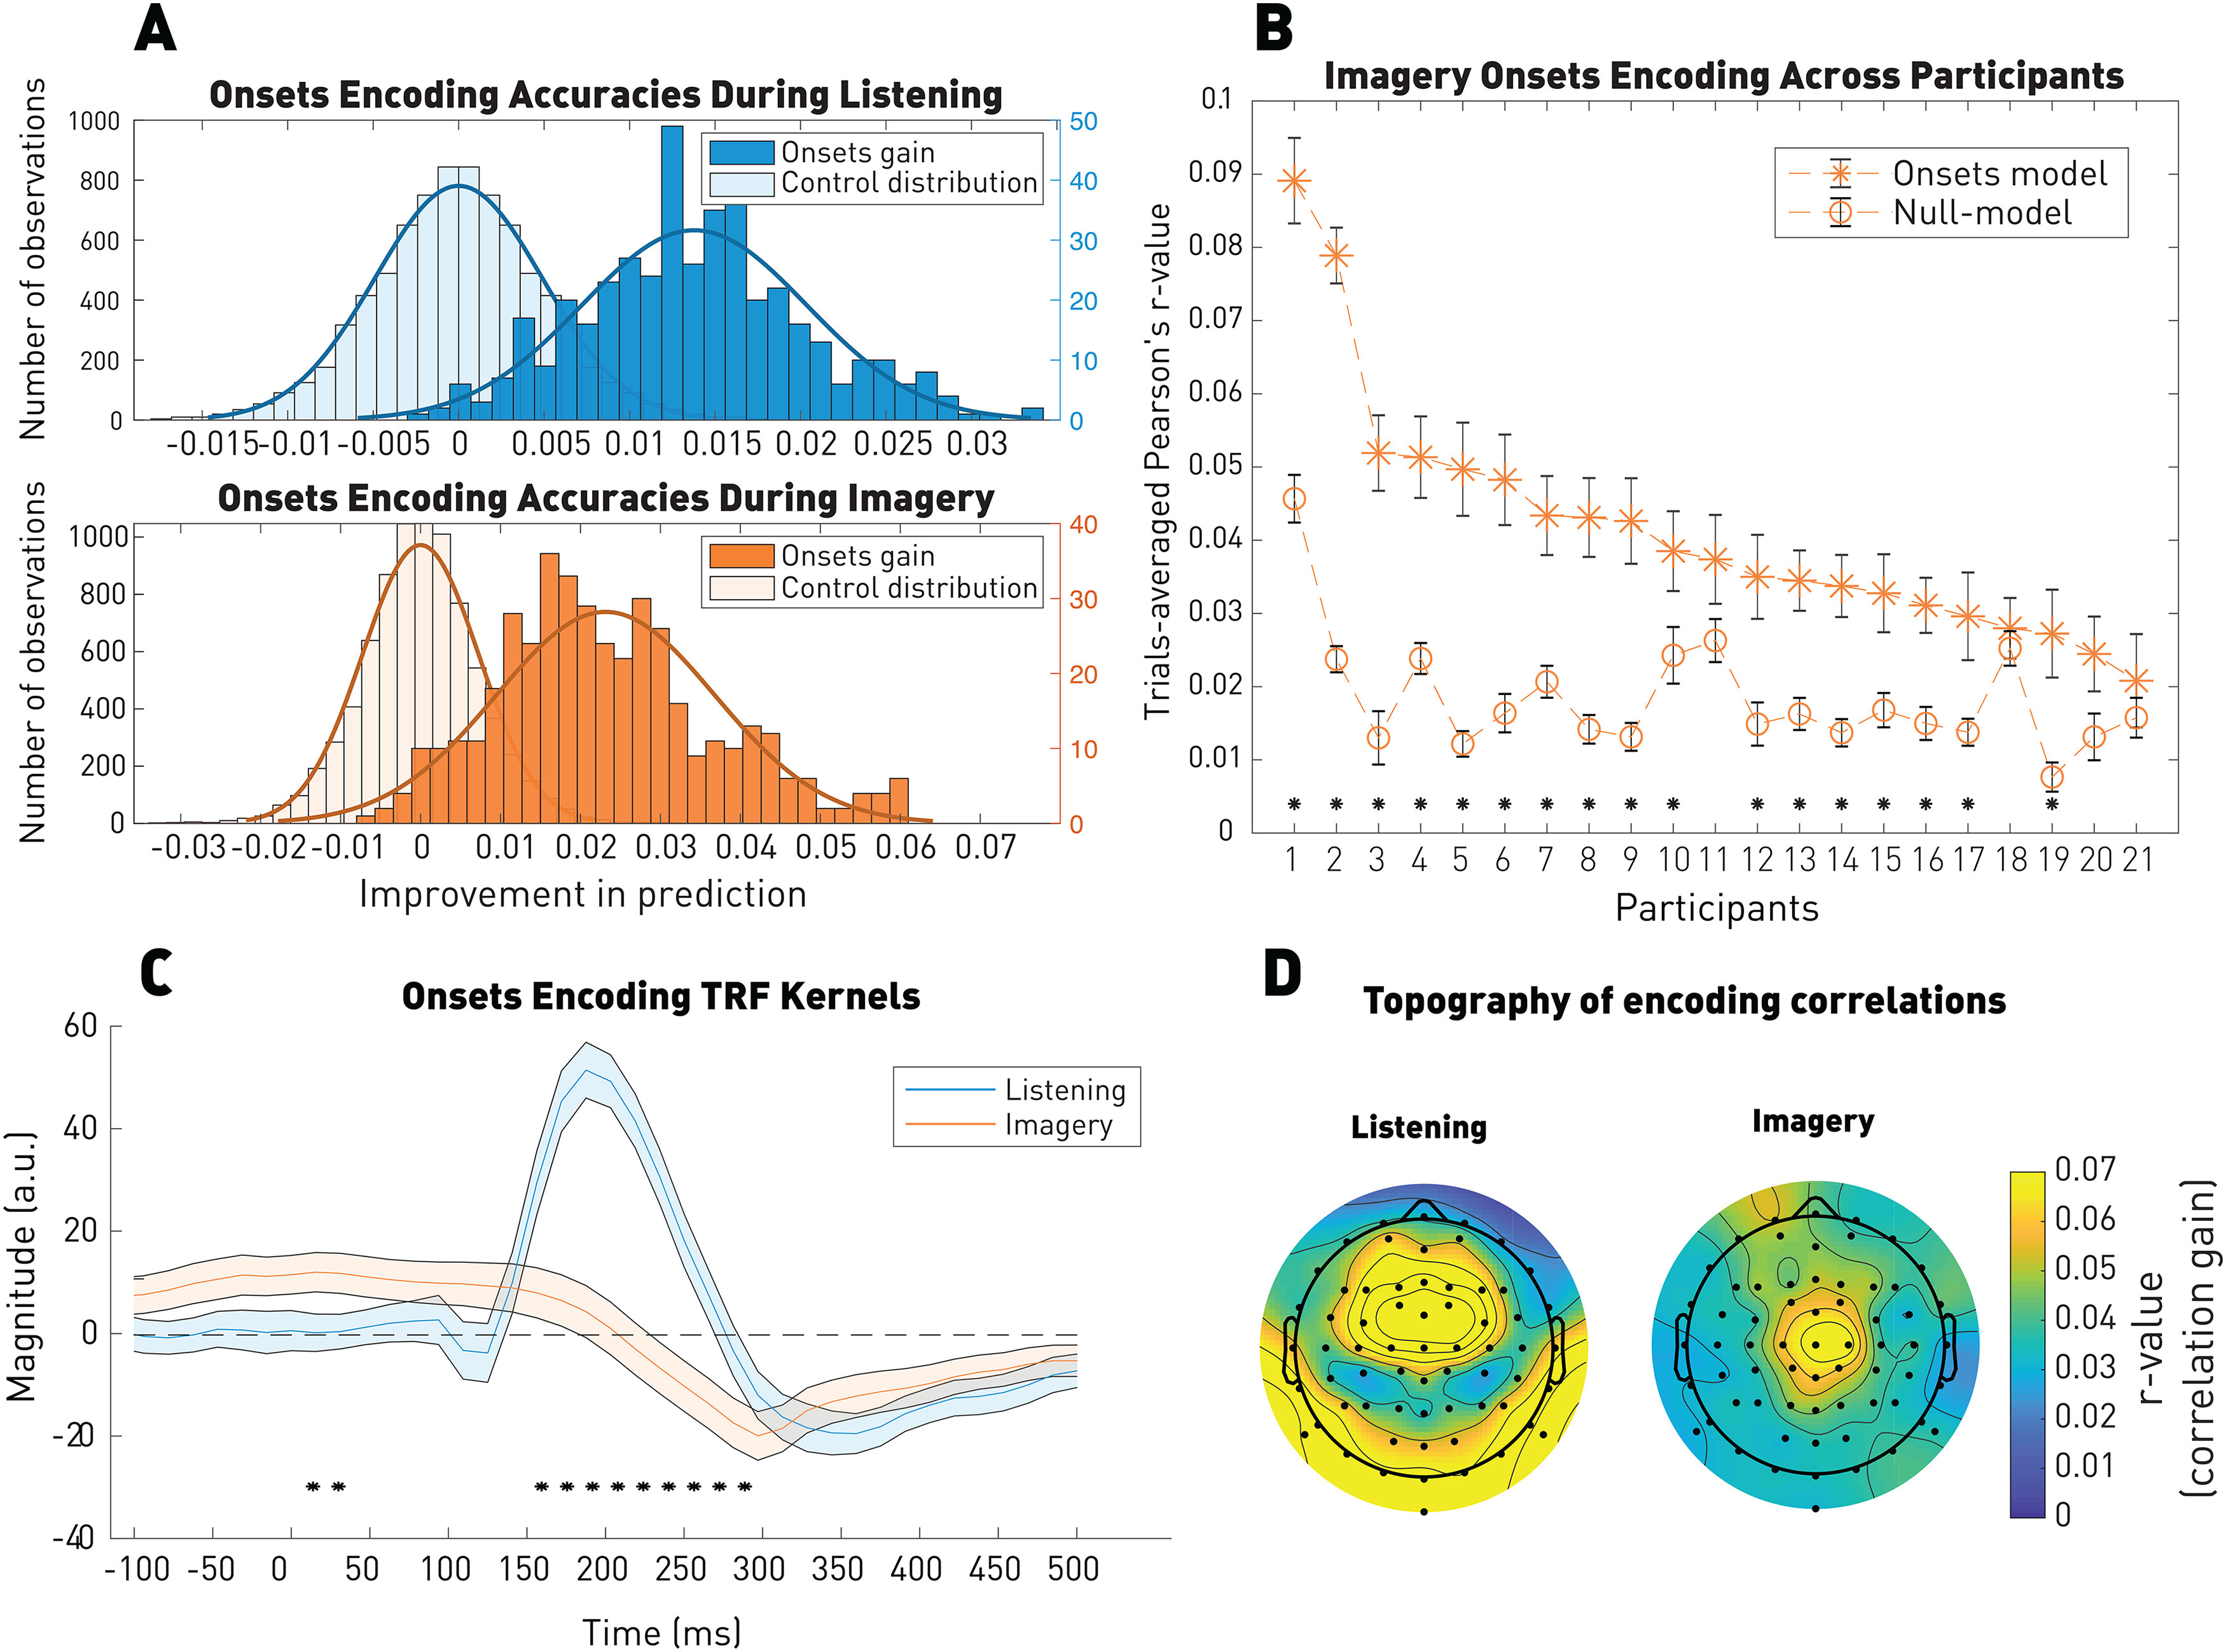
Figure 2.

Robust EEG encoding of note onsets during imagery. A, EEG prediction correlations for the listening (top) and imagery (bottom). EEG prediction correlations were significantly above the control distribution in both conditions. Distributions illustrate the note onsets correlation gain, adjusted relative to the null model, as well as the control distribution. As for all the next figures, the left y axis corresponds to the number of observations of the control distribution and the right y axis corresponds to the ones of the model of interest (here onsets gain). B, EEG prediction correlations for the imagery condition for individual participants. Error bars indicate the SE across the 44 trials. *p < 0.05. C, TRF kernels on Cz. Shaded areas represent the SE across participants (N = 21). Significance between the two kernels computed by a permutation test: *p < 0.05. D, Topography of the EEG predictions gain (onset model – null model). A significant (p < 0.05) correlation of r = 0.3 was measured between the topographies of the EEG prediction values for the two conditions (Pearson's correlation).
