
Figure 5.
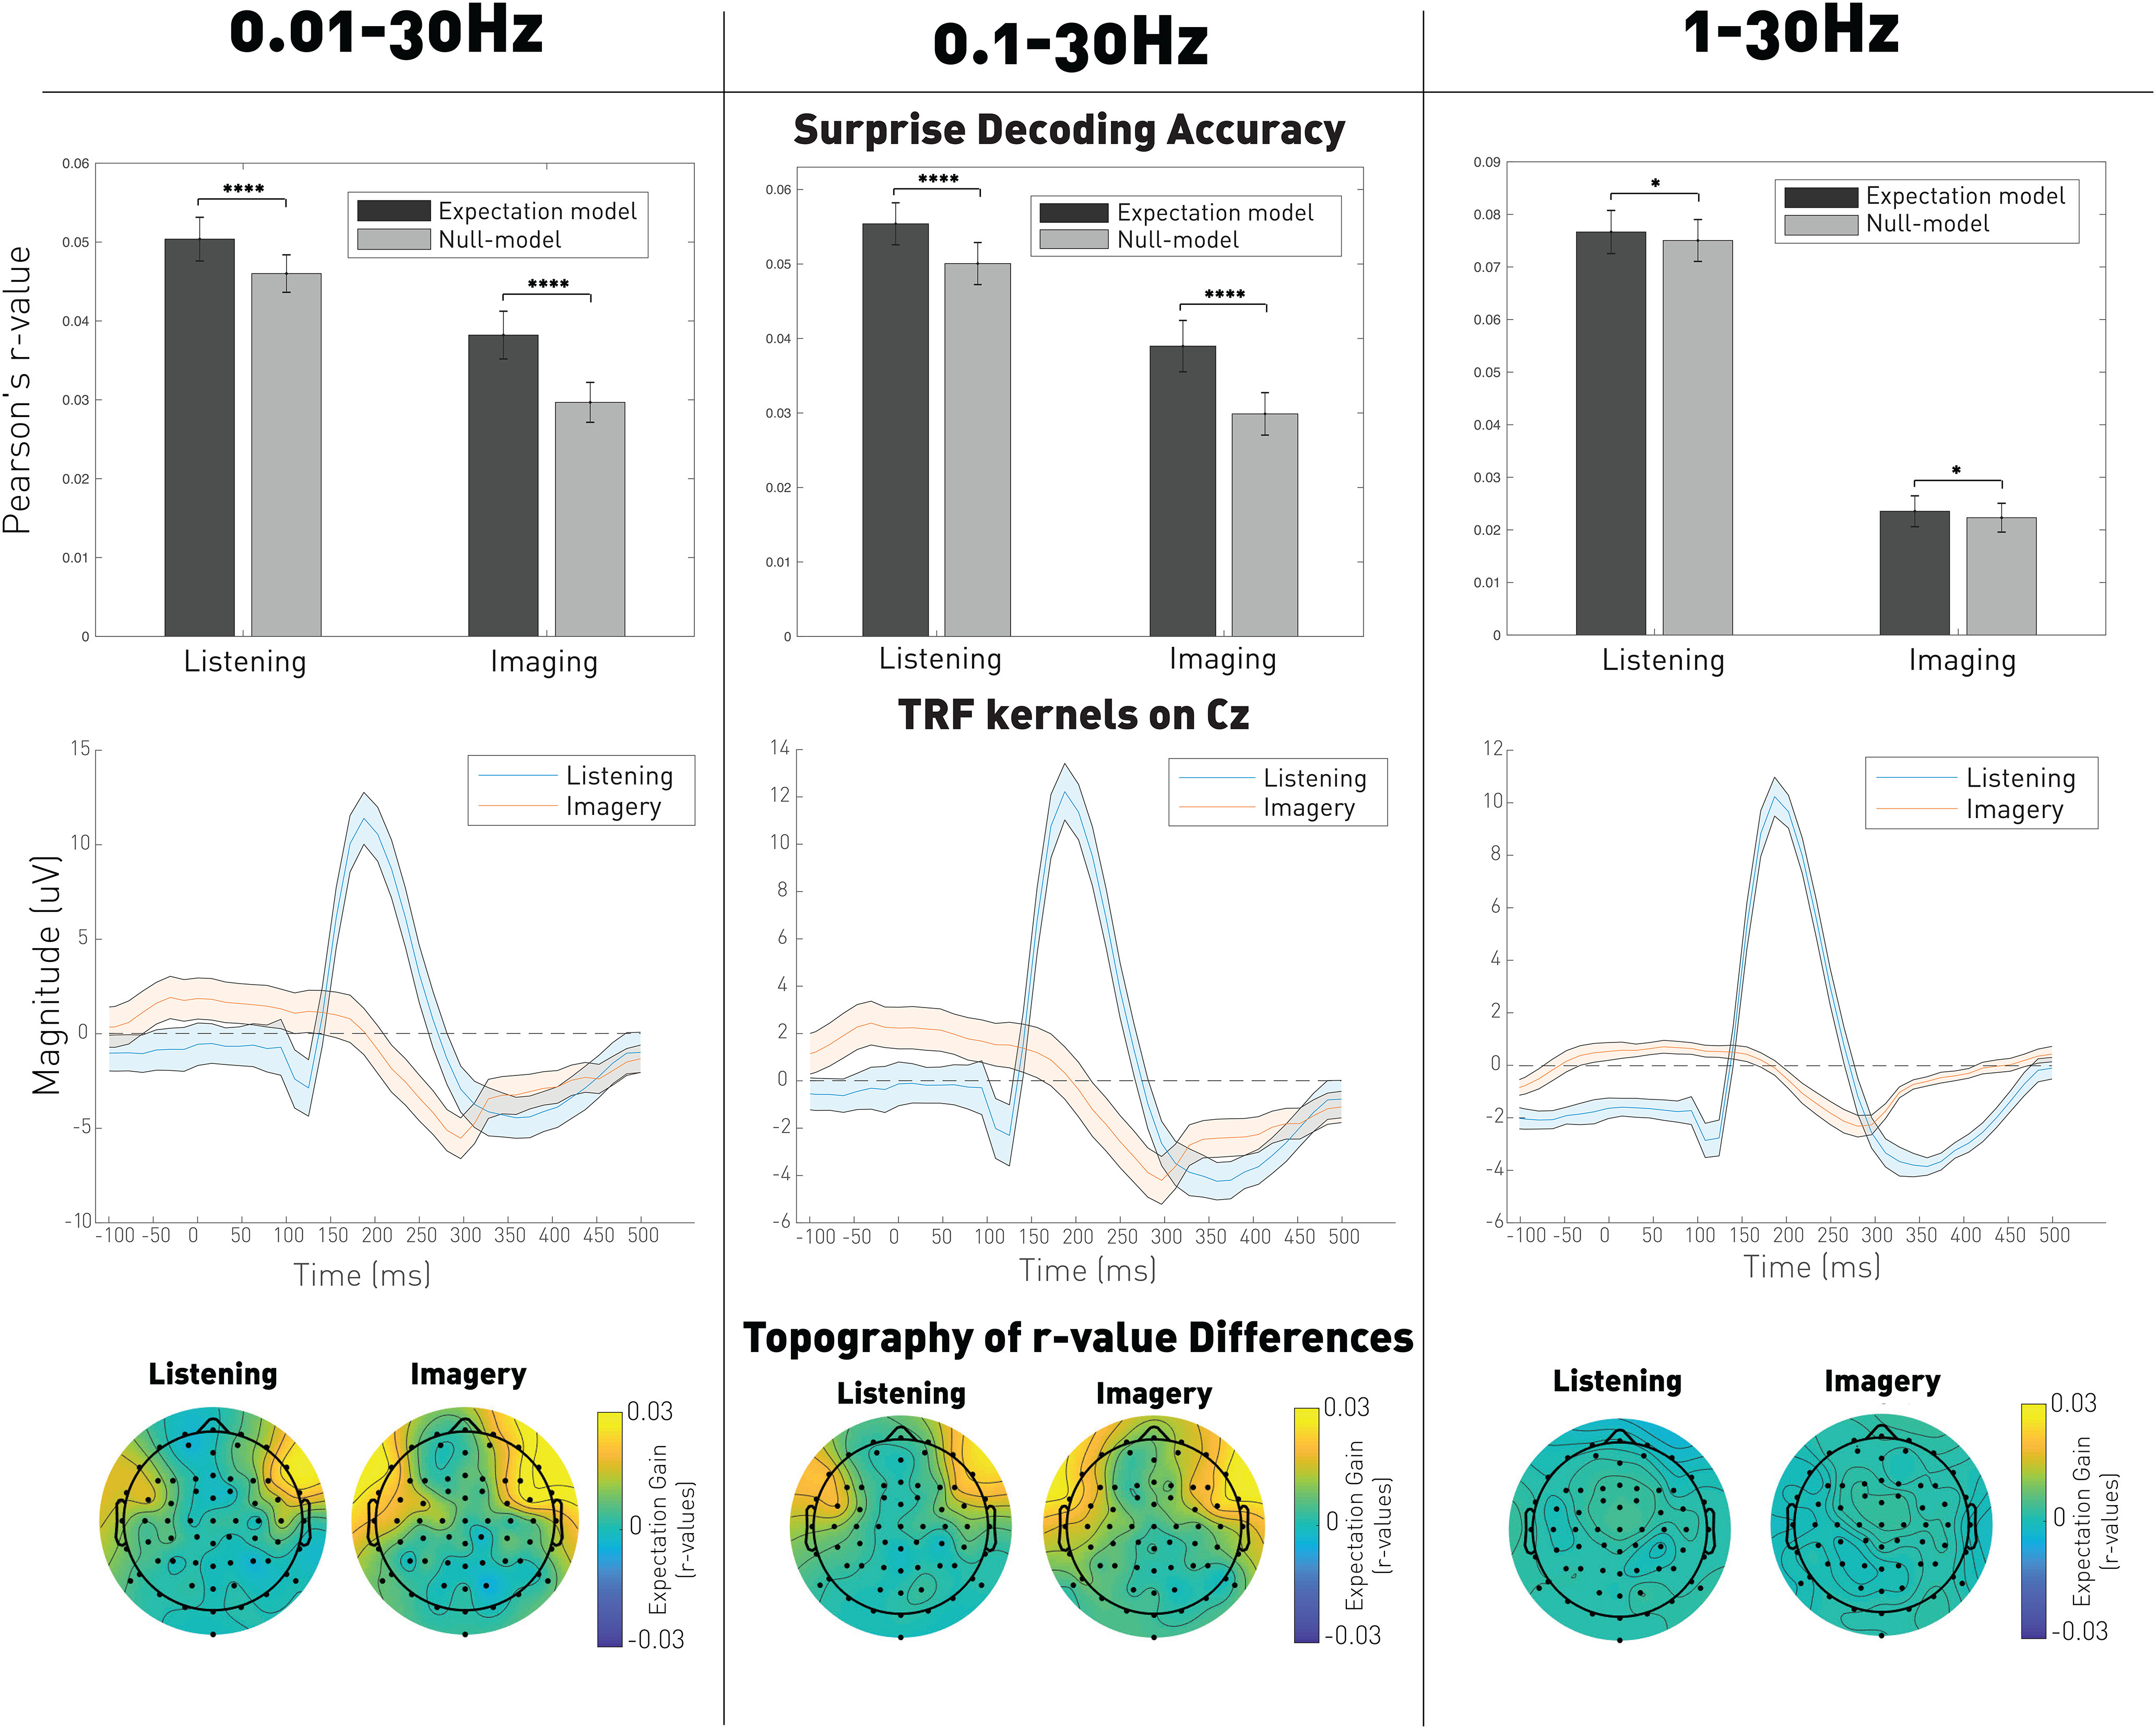
EEG encoding of the expectation signal by frequency bands (0.01-30, 0.1-30, and 1-30 Hz). Top, Averaged prediction correlations for both the expectation model and null models. Significance was computed using a Wilcoxon signed rank test paired by participants and averaged by trials and shuffling: ***p < 0.001; *p < 0.05. Middle, TRF kernels reflecting the average neural response on Cz. Shaded error bars indicate the SE across participants. Bottom, Topography of the prediction correlations gain (expectation model – null model) over the electrodes.