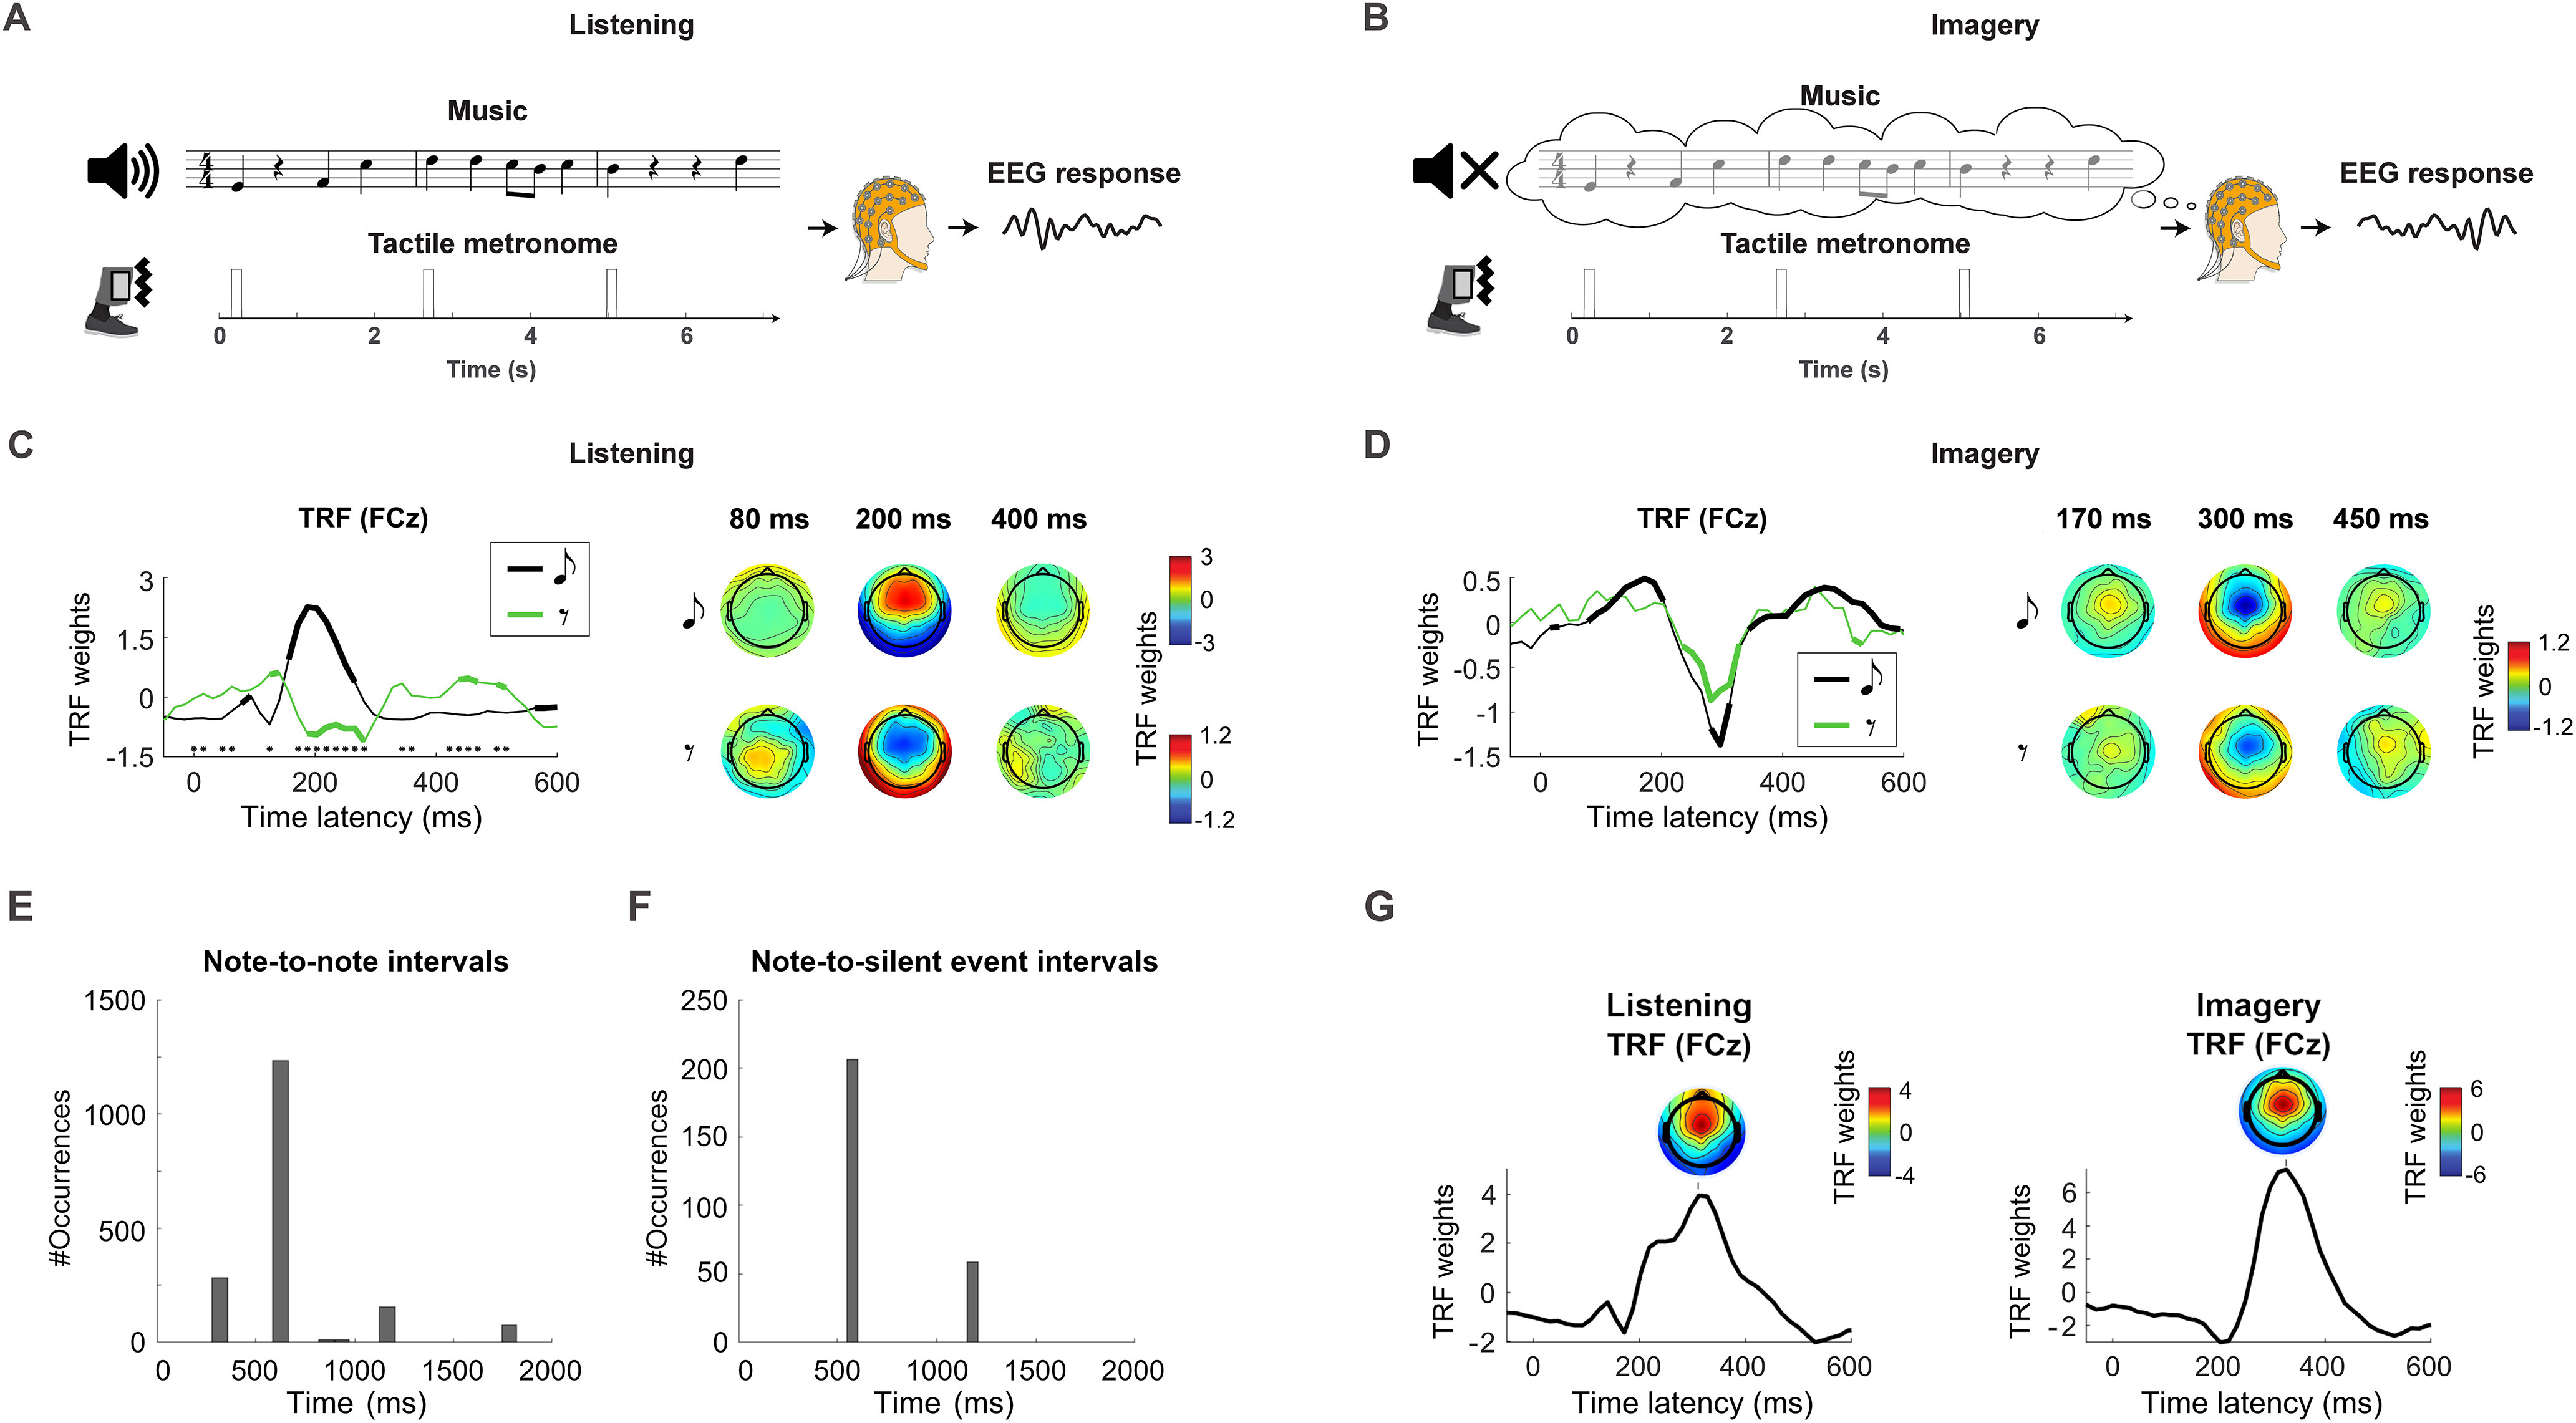
Figure 3.

Comparable cortical encoding of music silence and note during imagery. A, B, EEG signals were recorded as participants listened to and imagined piano melodies (experiment 2). A vibrotactile metronome placed on the left ankle allowed for the precise execution of the auditory imagery task. C, TRFs at the channel FCz (left) and topographies of the TRF at selected time latencies (right) are reported for the listening condition. Thick lines indicate TRF weights that are larger than the baseline at latency zero (FDR corrected Wilcoxon signed rank test, q < 0.01). Black asterisks indicate significant differences between NT and SIL (FDR corrected Wilcoxon signed-rank test, q < 0.01). D, The TRF results are reported for the imagery condition, showing a significant component centered at ∼300 ms for both note and silent-events with, as hypothesized, no significant difference between NT and SIL, which had the same polarity in this case. E, F, Overall distribution of time intervals between notes and between silent events and the immediately preceding note in experiment 2. The y-axis indicates the number of occurrences for a given bin of time intervals when considering all trials. G, TRFs were fit for the listening and imagery conditions using a univariate stimulus regressor marking the metronome with unit impulses (and zero at all other time points). TRFs are shown at the EEG channel FCz. Topographies depicting the TRF weights at all channels are also shown at the peak of the dominant TRF component.
