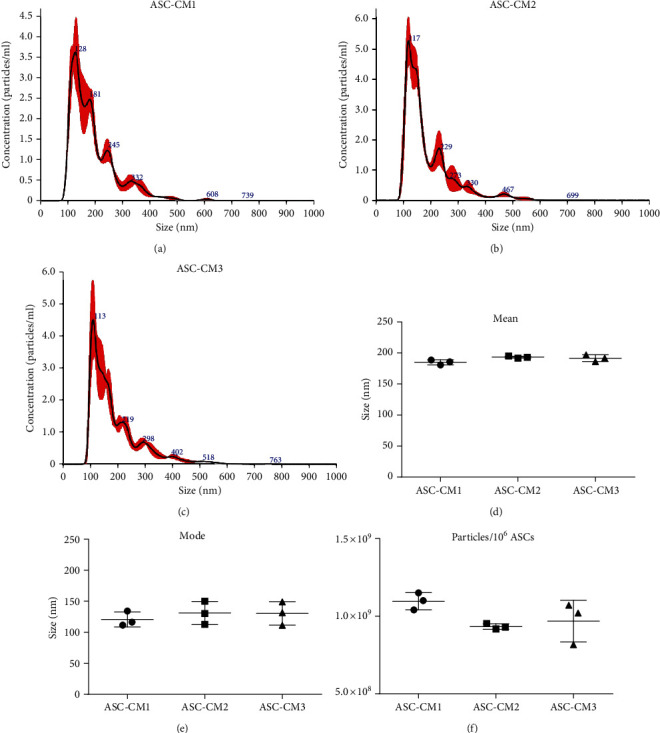
Figure 1.

Dimensional characterization and quantification of ASC-CM extracellular vesicles. (a–c) Representative images of NTA referred to ASC-CM1 (a), ASC-CM2 (b), and ASC-CM3 (c). (d–f) Size distribution (d, e) and vesicular yield (f) deriving from 3 NTA measurements/sample. Data are shown as the mean ± SD.
