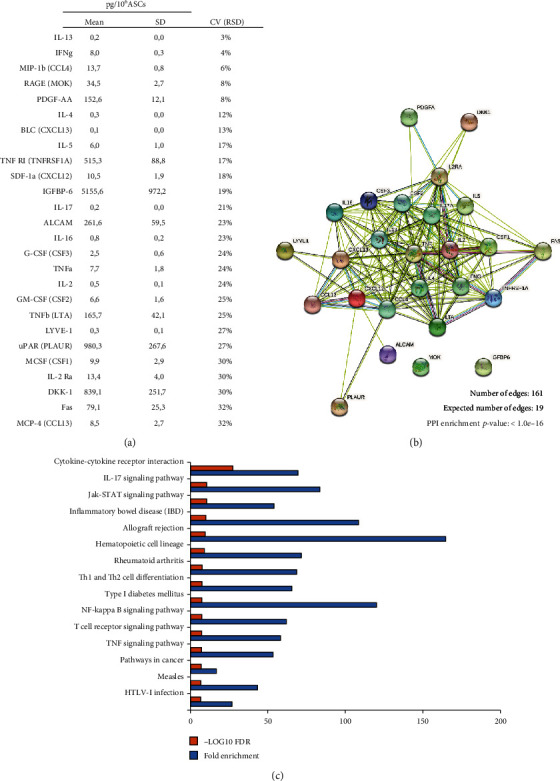
Figure 4.

Protein interactions and functional prediction of the 26 most homogeneous factors quantified in ASC-CM samples. (a) List of the 26 selected factors having a coefficient of variation below 33% (CV < 33%) and (b) corresponding protein-protein interactions uncovered by STRING analysis. (c) Top 15 KEGG pathways associated with the 26 proteins selected based on false discovery rate (FDR) p value (-log10 FDR p values are reported as orange bars). Fold enrichment was calculated as follows: Fold enrichment = (observed protein count/number of most homogeneous factors)/(background gene count/total gene number) and is reported as blue bars.
