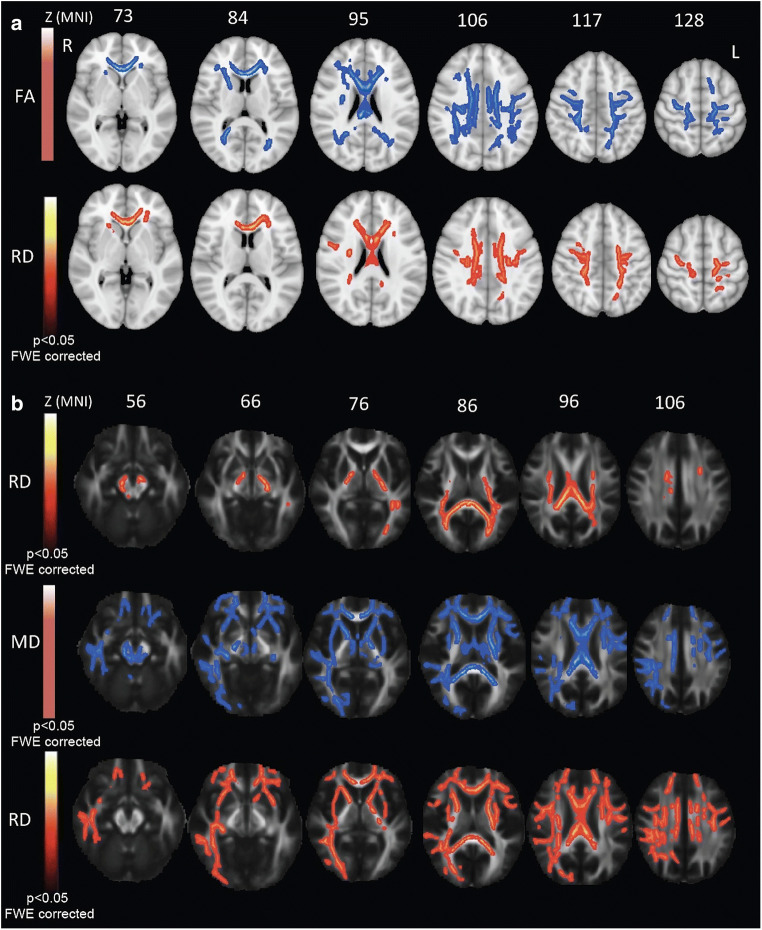
Fig. 4.
A TBSS DTI analysis. Comparison between FA (blue; upper panel) and RD (red-yellow; lower panel) statistic parametric maps of ALS patients versus HCs (p < .05, FWE corrected). B Voxel-wise correlation analysis between RD metrics and RAVLT immediate recall scores (red-yellow scale; upper panel); between MD metrics and Corsi Block-Tapping test score (blue scale; middle panel); and between RD metrics and Corsi Block-Tapping test score (red-yellow scale; lower panel) (p < .05, FWE corrected). FA = fractional anisotropy; MD = mean diffusivity; MNI = Montreal Neurological Institute; L = left; R = right; RAVLT = Rey Auditory Verbal Learning Test; RD = radial diffusivity

