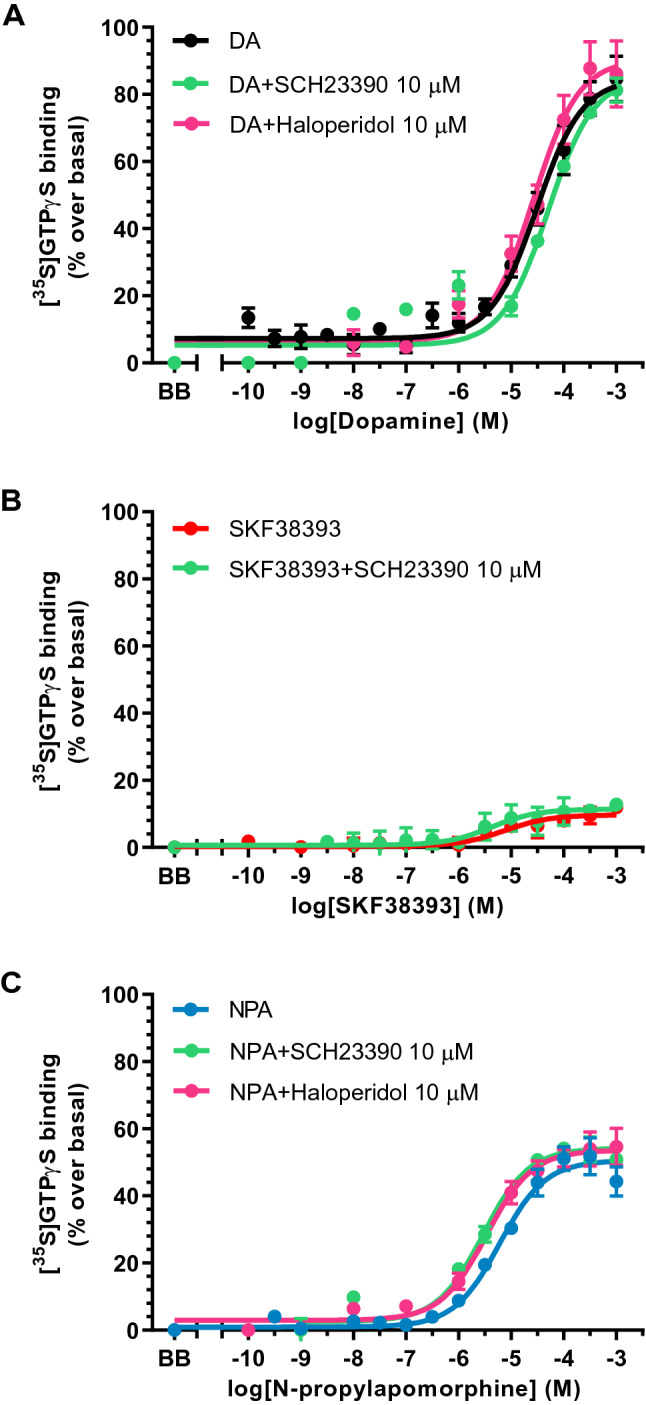
Fig. 2.

Concentration response curves of the [35S]GTPγS binding stimulation by increasing concentrations (10–10-10–3 M, 13 concentrations) of A dopamine (DA), B the selective D1R agonist SKF38393 and C the selective D2R agonist N-propylapomorphine (NPA) in absence and presence of the D1R antagonist SCH23390 (10 μM) or the D2R antagonist haloperidol (10 μM). Experiments were performed in human frontal cortex of 3–7 different control subjects. Points are mean ± standard error of the mean and represent the increase (in percentage) over respective basal values. BB represents the basal binding in absence of agonist
