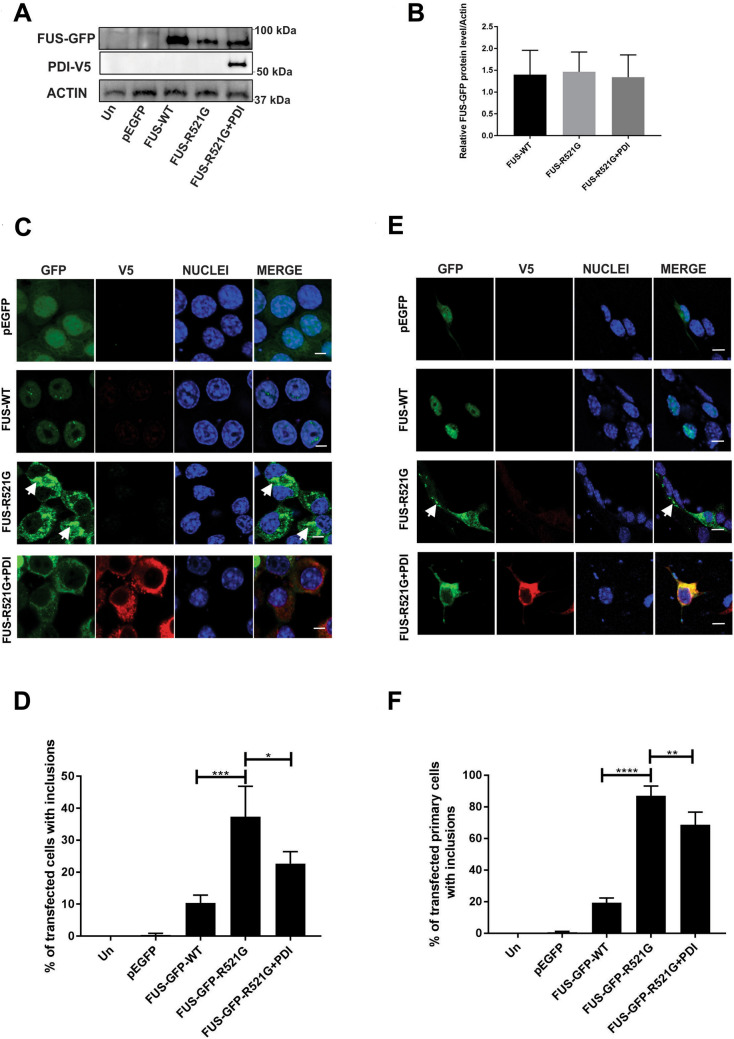
Figure 1.
Over-expression of PDI is protective against mutant FUS- induced inclusion formation in a neuronal cell line and primary cultures. (A) Western blotting of cell lysates, in which wild-type FUS-GFP (FUS-WT) was expressed with empty vector pcDNA3.1 and mutant FUS-GFP-R521G was expressed with either empty vector pcDNA3.1 or PDI-V5; untransfected (Un) cells are represented in the first lane. The blots were probed with anti-V5 antibody to confirm the presence of PDI, and reprobed with anti-FUS antibody and anti-actin as a loading control. Approximate molecular weight markers in kilodaltons are shown on the right. Whole blots showing the position of molecular weight marker bands are represented in supplementary Figure S1. (B) Densitometric quantitation of FUS protein levels normalized to actin from the immunoblots shown in (A) confirms similar transfection efficiency in each population and that similar amounts of each protein were expressed. (C) Immunofluorescence of EGFP in cells expressing EGFP (row 1), FUS-GFP-WT (row 2) or mutant FUS-GFP-R521G with empty vector (row 3, inclusions > 1 µm, highlighted by white arrows), co-expressed with PDI (row 4), 72 h post-transfection. Scale bar = 5 µm. (D) Quantification of cells in (C) reveals significantly fewer cells formed inclusions when PDI (*p < 0.05) was co-expressed with FUS-GFP-R521G compared to empty vector. (E) Immunofluorescence detection of EGFP-positive inclusions (> 1 µm), present in mouse primary cells co-expressing EGFP only (row 1), FUS-GFP-WT (row 2) or mutant FUS-GFP-R521G with empty vector (row 3), with PDI (row 4). Scale bar = 10 µm. (F) Quantification of cells in (E) reveals significantly fewer cells formed inclusions when PDI (**p < 0.01) was co-expressed with FUS-GFP-R521G compared to vector only. Values represent mean ± SD, n = 3. ****p < 0.0001, ***p < 0.001, **p < 0.01, *p < 0.05.

