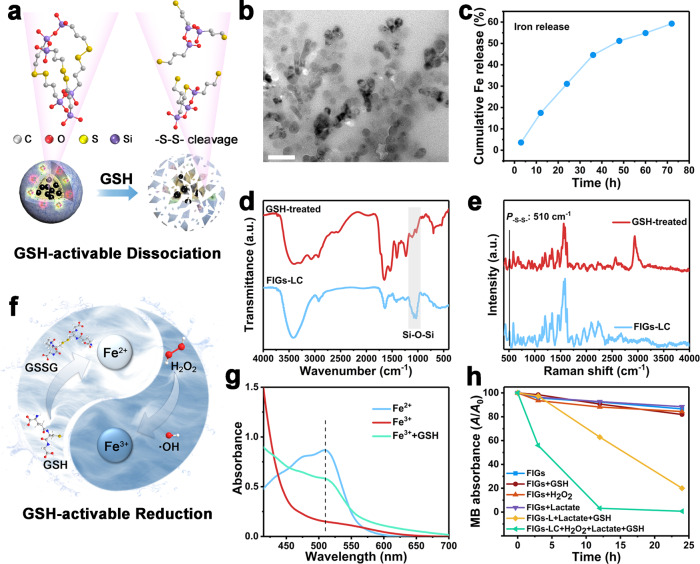
Fig. 3. Responsive behaviors of FIGs-LC to tumor microenvironment.
a Schematic of GSH-induced –S–S– cleavage, leading to the collapse of FIGs-LC and iron release. b TEM images of FIGs-LC after a 5-day incubation in the simulated TME solutions (containing 100 μM of H2O2, 10 mM of GSH, and 2 mM of lactate, pH 6.0), scale bar:100 nm. c Cumulative Fe ions release from FIGs-LC in the simulated TME solutions. d FT-IR spectra of the FIGs-LC and GSH-treated FIGs-LC. e The Raman shift of the FIGs-LC and GSH-treated FIGs-LC. f Schematic cycle of Fe3+ and Fe2+ in the tumor microenvironment. g UV-Vis spectra of Fe2+ solution and Fe3+ solution after adding 1,10-phenanthroline monohydrate. Specially, the emerging peak at 510 nm indicated the Fe3+ was converted into Fe2+ by GSH. h The MB degradation (A/A0) curves under different conditions.

