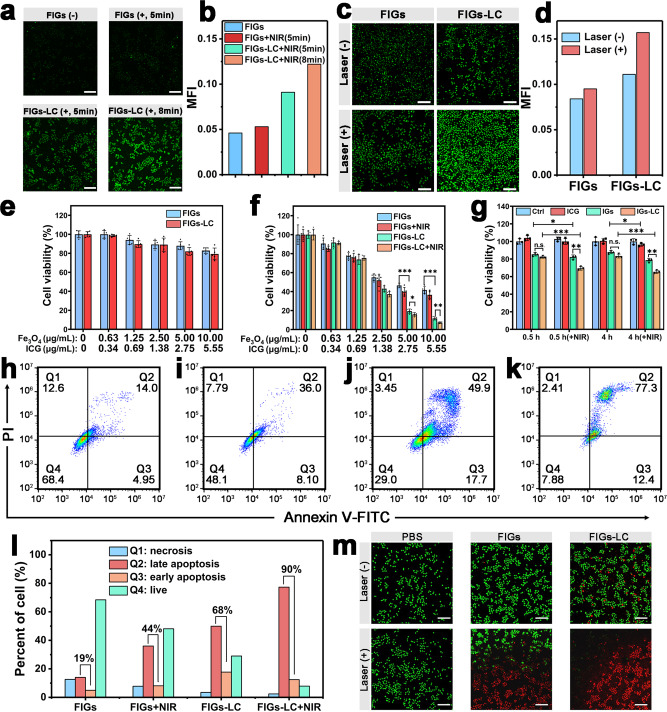
Fig. 5. Intracellular characterization for synergistic CDT and PDT.
a Confocal laser scanning microscopy (CLSM) images and corresponding mean fluorescence intensity (b) of human hepatocarcinoma cells (SMMC-7721) cells after co-incubation with FIGs or FIGs-LC for 6 h and treated with SOSG probe, “−” represents without laser irradiation and “+” represents with laser irradiation, scale bar: 200 μm. c CLSM images and corresponding mean fluorescence intensity (d) of SMMC-7721 cells treated with FIGs, and FIGs-LC for 12 h with DCFH-DA as a ROS detector, scale bar: 200 μm. e Cell viabilities of NIH-3T3 cells after incubation with FIGs or FIGs-LC for 48 h. f Cell viabilities of SMMC-7721 cells after incubation with FIGs or FIGs-LC for 48 h with or without NIR irradiation (NIR: 808 nm, 0.25 W, 5 min). g Cell viabilities of SMMC-7721 cells under hypoxic condition after incubation with ICG, IGs, or IGs- LC, the NIR irradiation was carried out after 0.5 or 4 h co-incubation (NIR: 808 nm, 0.25 W). In e–g, data are presented as mean ± s.d. from five (e, f) or three (g) independent replicates, p values were analyzed by Student’s two-sided t-test (*p < 0.05, **p < 0.01, ***p < 0.001, n.s. represents no significant differences). h–k Cell apoptosis of SMMC-7721 cells with FIGs, FIGs + NIR, FIGs-LC, and FIGs-LC + NIR incubation was determined by Annexin V-FITC/PI staining. l Quantitation of the cell apoptosis of SMMC-7721 cells under different treatments; the percent represents Q2 + Q3. m CLSM images of live/dead staining of SMMC-7721 cells after incubation with PBS, FIGs, FIGs-LC for 12 h with or without laser irradiation, live cells were stained with Calcein-AM and dead cells were stained with PI, scale bar: 200 μm.

