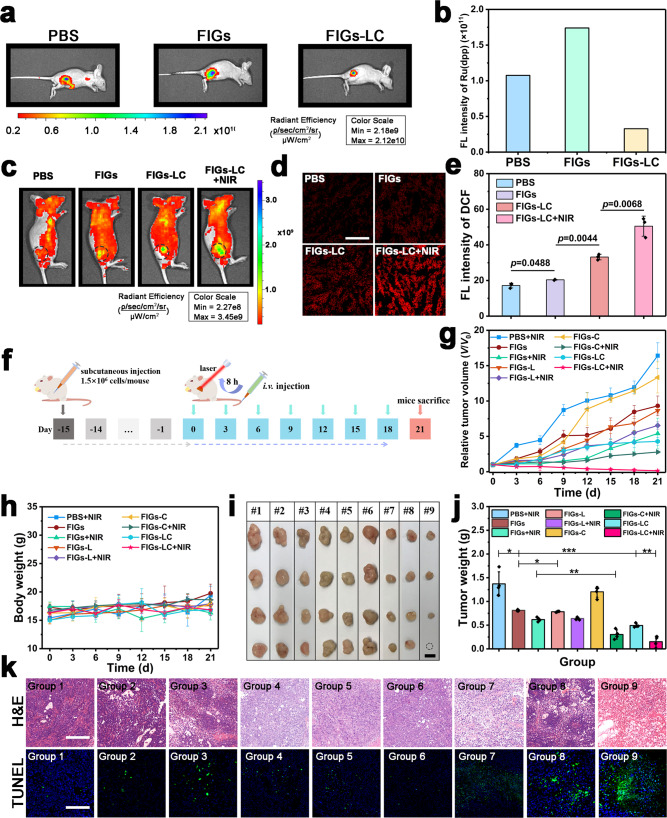
Fig. 6. Therapeutic effect of FIGs-LC on the subcutaneous SMMC-7721 tumor mice model.
a Intratumoral fluorescence imaging of O2 indicator Ru(dpp) after co-injected with different solutions into tumor tissues and b the relative semi-quantitative fluorescence intensity. c Intratumoral fluorescence imaging of ROS by DHE after co-injected with different solutions into tumor tissues and the NIR irradiation was conducted after 4 h. d DCFH-DA-stained tumor tissue sections from different groups at 12 h post-injection, scale bar: 200 μm. e Semi-quantitative fluorescence intensity of DCF. f Schematic illustration of in vivo treatment on tumor-bearing nude mice. Change in relative tumor volume (g) and body weight (h) during the treatment. i Digital photos of the excised tumors from the tumor-bearing mice after 21 days of treatment (1# (Group 1): PBS + NIR, 2# (Group 2): FIGs, 3# (Group 3): FIGs + NIR, 4# (Group4): FIGs-L, 5# (Group5): FIGs-L + NIR, 6# (Group 6): FIGs-C, 7# (Group7): FIGs-C + NIR, #8 (Group 8): FIGs-LC, #9 (Group 9): FIGs-LC + NIR), dot circle represents the tumor was eliminated completely, scale bar: 10 mm. j Average weight of excised tumors from the tumor-bearing mice after 21 days of treatment. k H&E staining and TUNEL staining images of tumor slices, scale bar: 200 μm. In b, data are presented as mean from two independent animal experiments. In e, g, h, j, data are presented as mean ± s.d. from three (e) or four (g, h, j) independent animal experiments, p values were analyzed by Student’s two-sided t-test (*p < 0.05, **p < 0.01, ***p < 0.001, n.s. represents no significant differences).

