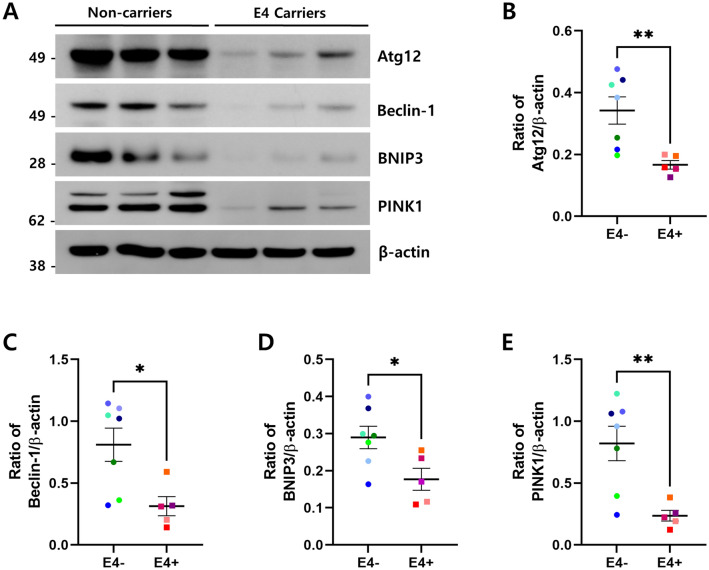
Figure 2.
Protein levels of FoxO3a downstream genes decreased in ApoE4 carriers. The protein levels of Atg12, Beclin-1, BNIP3, PINK1, and β-actin in ApoE4 non-carriers (n = 7, E4−) vs. carriers (n = 5, E4 +) were analyzed by immunoblotting using the corresponding antibodies, respectively. (A) shows the representative western blot analysis of Atg12, Beclin-1, BNIP3, and PINK1. β-actin was used as a loading control. Full blots are provided in Supplementary Fig. S4. Relative ratio of Atg12 (B), Beclin-1 (C), BNIP3 (D) and PINK1 (E) against the protein level of β-actin. Data shown are mean ± SEM and were analyzed using the Student’s t-test. (*p < 0.05, **p < 0.01).

