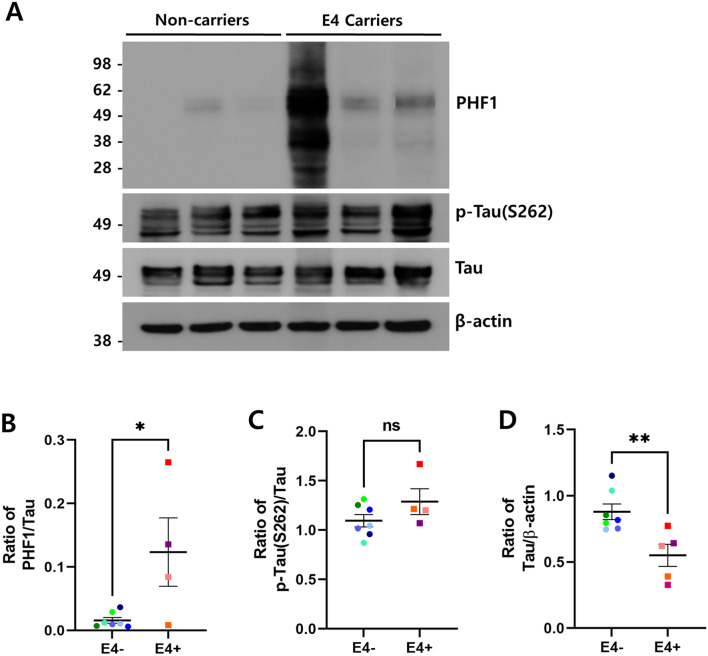
Figure 4.
Phosphorylated tau increased in the brain of ApoE4 carriers. The protein levels of phosphorylated tau, total tau, and β-actin in ApoE4 non-carriers (n = 7, E4−) vs. carriers (n = 5, E4 +) were analyzed by immunoblotting using the corresponding antibodies, respectively. (A) shows the representative western blot analysis of tau phosphorylated at Ser396/404 (PHF1) and Ser262 (p-tau [S262]) and total tau proteins. β-actin was used as a loading control. Full blots are provided in Supplementary Fig. S4. Relative ratio of tau phosphorylated at Ser396/404 (B) and Ser262 (C), and total tau (D) to the protein levels of tau and β-actin, respectively. All data are presented as mean ± SEM. (*p < 0.05, **p < 0.01). ns not significant.

