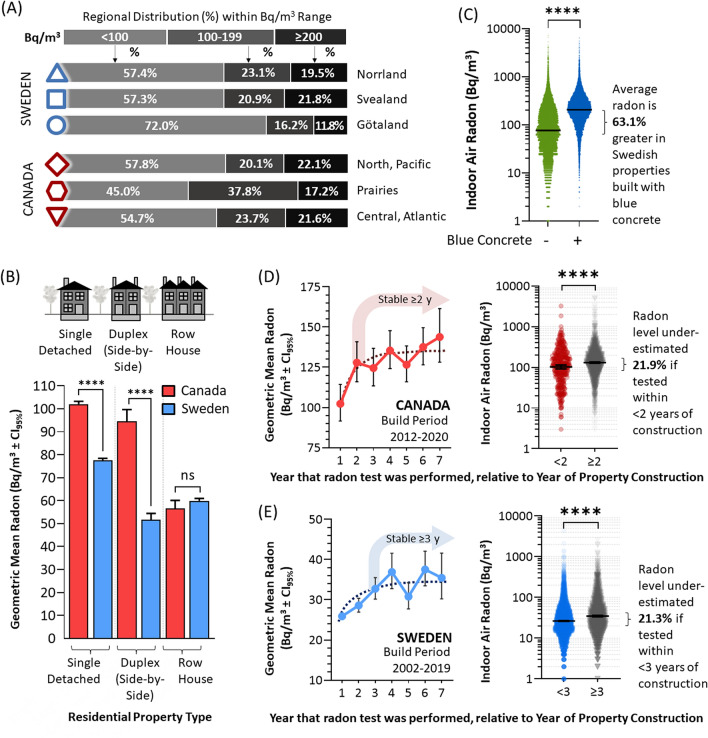
Figure 2.
Radon outcomes by region and build type, and addressing confounding variables relating to concrete dynamics. Panel (A). The percentage of properties that were < 100 Bq/m3, 100–199 Bq/m3, or ≥ 200 Bq/m3 as by Canadian (red) and Swedish (blue) regions, as indicated and aligning with Fig. 1A. Panel (B). Geometric mean radon (with CI95%) for Canada (red) and Sweden (blue) by residential property type, as depicted in the inset cartoon. Panel (C). Dot plots of individual Swedish radon test outcomes in houses built using blue concrete (blue, transparency set to 50% to visualize data density) or not (green, transparency set to 50% to visualize data density). Black bars indicate geometric mean radon. Panels (D), (E). Left graphs show geometric mean radon levels ± CI95% in Canada (red) and Sweden (blue) as a function of the year of testing relative to the year of property construction, with right panels showing dot plots of corresponding data (transparency set to 50% to visualize data density) grouped as indicated. Statistical analysis was done using Mann–Whitney pairwise nonparametric t-tests of dot plot data. **** = p < 0.0001; ns = p > 0.05. Figures were prepared using Excel and GraphPad Prism 9.1.1 (225) (www.graphpad.com).

