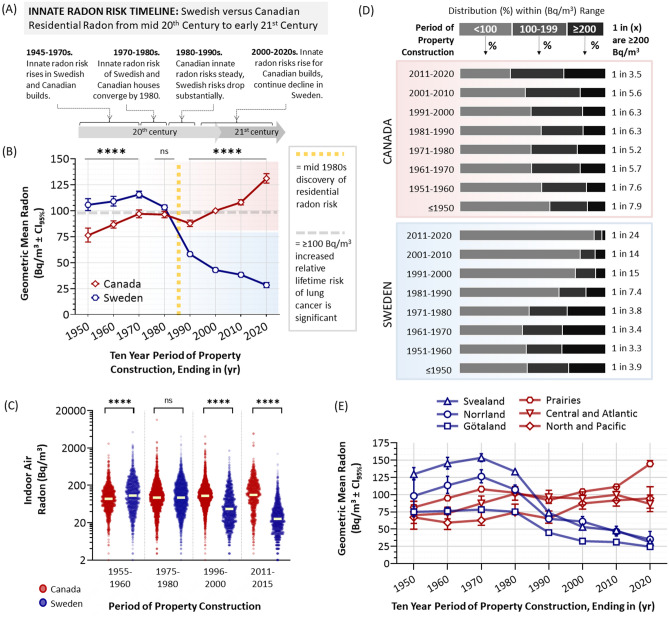
Figure 3.
Time series of innate radon risk in Swedish and Canadian properties as a function of period of construction. Panel (A). An annotated timeline of major fluctuations in innate radon risk of a property from the twentieth to the twenty-first century. Panel (B). Geometric means ± CI95% for 10-year periods of residential property construction (x-axis shows year ending decade, e.g., 2020 corresponds to 2011–2020, 1990 corresponds to 1981–1990, etc.) for Sweden (blue line with hexagons) and Canada (red line with diamonds). The vertical yellow dotted line indicates the period (1984) that the risk of high radon in residences was first documented globally. The horizontal grey dashed line indicates the radon level (100 Bq/m3) at or above which a statistically significant increase in relative lifetime risk of lung cancer is evident. Panel (C). Dot plots of source data from (B), clustered into sample 5-year periods for Canada (red) versus Sweden (blue), with transparency set to 50% to visualize data density. Panel (D). The percentage of properties that were < 100 Bq/m3, 100–199 Bq/m3, or ≥ 200 Bq/m3 as by Canadian (red) and Swedish (blue) periods of property construction (as indicated). Panel (E). The same data as in (B), but split into the Canadian (red) and Swedish (blue) regions, as indicated and aligning with Fig. 1A. Statistical analysis was done using Mann–Whitney pairwise nonparametric t-tests of dot plot data or 1-way ANOVA for all other data. **** = p < 0.0001; ns = p > 0.05. Figures were prepared using Excel and GraphPad Prism 9.1.1 (225) (www.graphpad.com).

