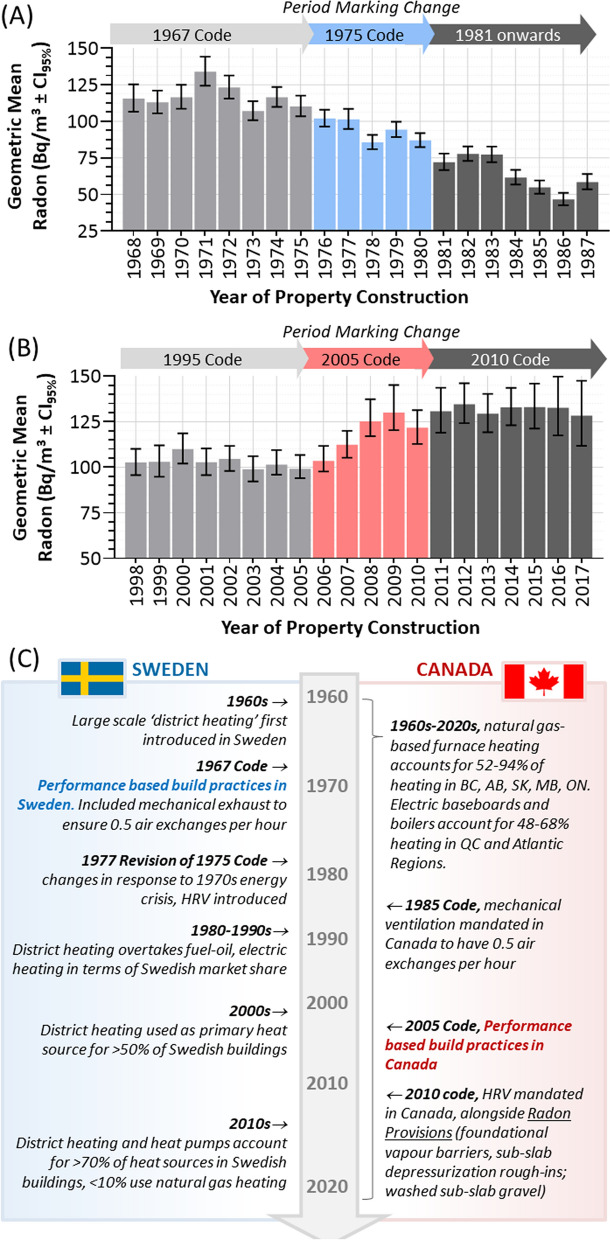
Figure 5.
Periods marking notable changes in Swedish and Canadian residential property innate radon risk, and key build code and energy use trends since 1960. Panel (A). Yearly geometric mean radon levels ± CI95% for residential property construction in Sweden from 1968 to 1987, indicating build codes that applied during each year. Panel (B). Yearly geometric mean radon levels ± CI95% for residential property construction in Canada from 1998 to 2017, indicating build codes that applied during each year. Panel (C). Timeline schematic of 1960–2020, indicating relevant events in Sweden (left, blue) and Canada (right, red). Figures were prepared using GraphPad Prism 9.1.1 (225) (www.graphpad.com).

