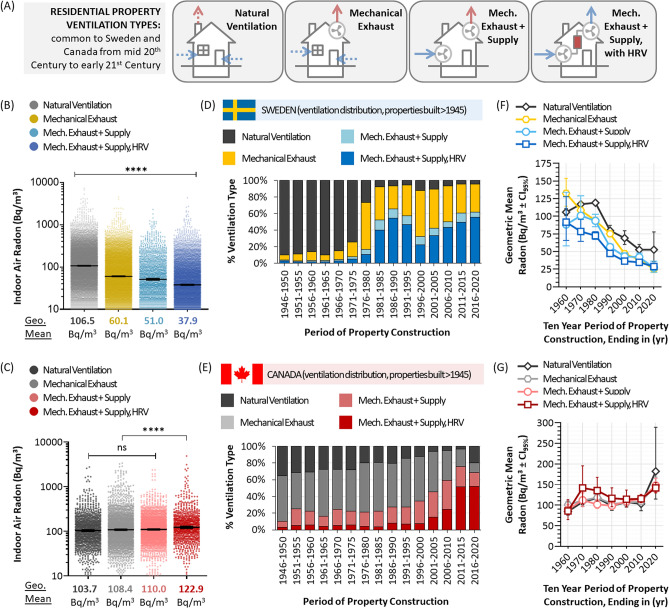
Figure 6.
Innate radon risks in Swedish and Canadian residential properties as a function of ventilation type. Panel (A). A depiction of the four major types of residential building ventilation in Sweden and Canada. Panels (B), (C). Dot plots of radon in Swedish (B) and Canadian (C) properties as a function of ventilation types from (A), with transparency set to 50% to visualize data density. Geometric mean radon values are shown below the graph. Panels (D), (E). The percent distribution of each ventilation type from (A) over time in Sweden (D) and Canada (E). Panels (F), (G). The geometric means ± CI95% for 10-year periods of residential property construction (x-axis shows year ending decade, e.g., 2020 corresponds to 2011–2020, 1990 corresponds to 1981–1990, etc.) for Sweden (F) and Canada (G). Statistical comparisons are Mann–Whitney pairwise nonparametric t-tests of comparisons for dot plot data or 1-way ANOVA for all other data. **** = p < 0.0001; ns = p > 0.05. Figures were prepared using Excel and GraphPad Prism 9.1.1 (225) (www.graphpad.com).

