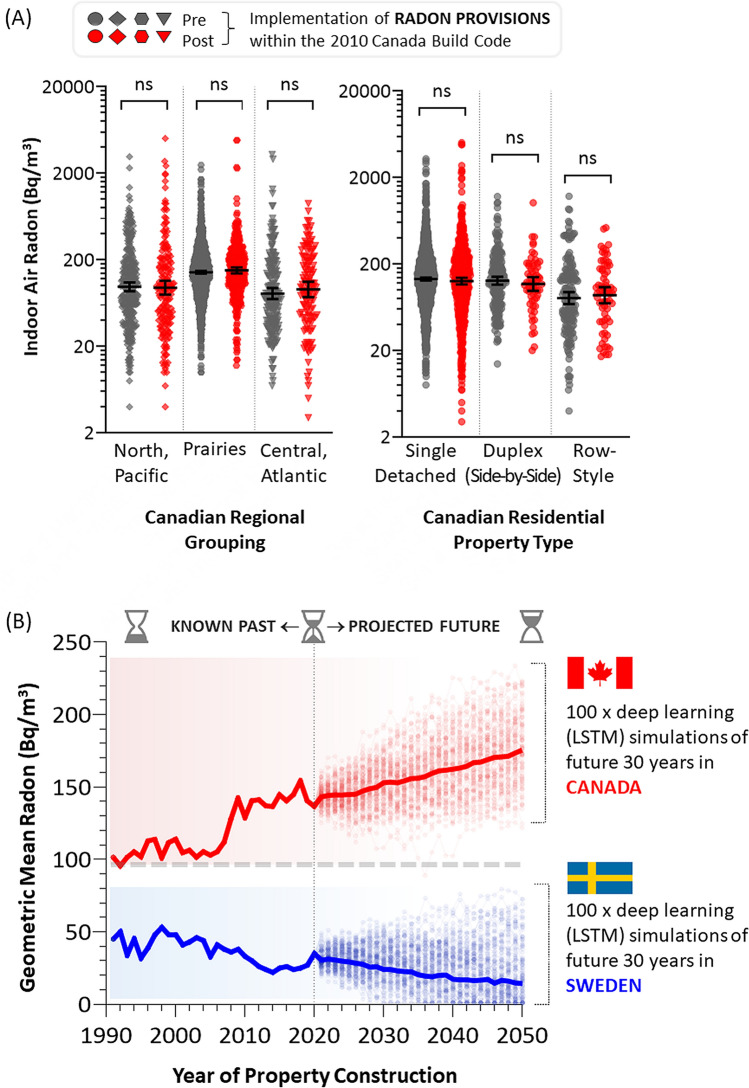
Figure 7.
Impact of the 2010 Canada build code on radon, and deep learning predictions of radon in Canada and Sweden by 2050. Panel (A). Dot plots of radon as a function of region (left) and property type (right) in Canadian properties built up to 10 years before (grey symbols) the 2010 Canada Build Code was adopted or after (red symbols). Statistical comparisons are Mann–Whitney pairwise nonparametric t-tests ns = p > 0.05. Panel (B). Deep learning predictions of future innate residential radon levels between 2021 and 2050, as a function of known trends from 1991 to 2020. Solid lines (red for Canada, blue for Sweden) represent known geometric mean radon for the period before 2021, or the geometric average of 250 long short-term memory (LSTM) network predictions (shown as 50% transparent lines with dots) for the projected future up to 2050. Figures were prepared using GraphPad Prism 9.1.1 (225) (www.graphpad.com).

