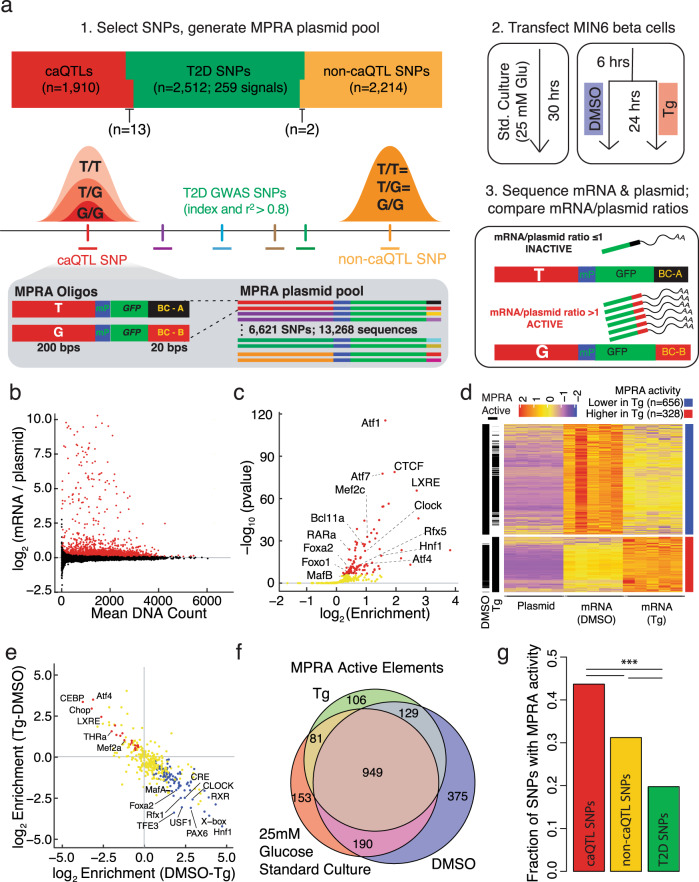
Fig. 1. Massively parallel reporter assay (MPRA) identifies steady state and ER stress-responsive transcription activating sequences in β cells.
a Schematic of MPRA study workflow to identify β cell transcription activating sequences. Sequences containing each allele of 2512 SNPs associated with T2D (T2D SNPs), 1910 associated with altered islet chromatin accessibility (caQTLs), and 2214 overlapping islet ATAC-seq peaks but not associated with altered in vivo islet chromatin accessibility (non-caQTL) were selected and tested for their ability to activate transcription in MIN6 β cells under three conditions. Std standard, Glu glucose; DMSO dimethylsulfoxide, Tg thapsigargin, mP minimal promoter, BC barcode. b Log2 ratios of barcode/sequence counts in gfp mRNA of transfected cells compared to those in the MPRA plasmid library in MIN6 β cells grown under standard culture conditions. Each point represents a 200 bp sequence that was tested. Red points denote MPRA active sequences at FDR < 1% (n = 2224/13,628). c Transcription factor (TF) binding motifs enriched in MPRA active elements (≥1 allele) in MIN6 cells grown under standard culture conditions (25 mM glucose). Red dots denote TF binding motifs enriched at FDR < 1%). d Heatmap of z-scores for sequences with significantly (FDR < 1%) higher (far right column, red bar; n = 328, mapping to 275 elements) or lower MPRA activity (blue bar; n = 656, mapping to 449 elements) in Tg-treated cells compared to DMSO solvent control. Black annotation bars to the left of the heatmap indicate sequences identified as MPRA active in DMSO and/or Tg based on their sequence counts in RNA vs. plasmid DNA input. e Transcription factor (TF) binding motifs significantly enriched (FDR < 1%) in elements identified in d with higher (red dots) or lower (blue dots) MPRA activity under ER stress. Yellow dots denote TF motifs with no significant enrichment in either comparison. f Venn diagram showing the number of elements (≥1 allele) with MPRA activity (FDR < 1%) in each experimental condition. g Fraction of 200 nucleotide sequence elements containing caQTL (n = 824/1910), non-caQTL (707/2218), or T2D-associated (n = 492/2215) SNPs with ≥1 allele identified as MPRA active in ≥1 experimental condition. Two-sided Fisher’s Exact p = 3.12e−16 (caQTL vs. non-caQTL SNPs), 1.50e−63 (caQTL vs. T2D SNPs), and 1.23e−19 (non-caQTL vs. T2D SNPs). ***p < 0.001.

