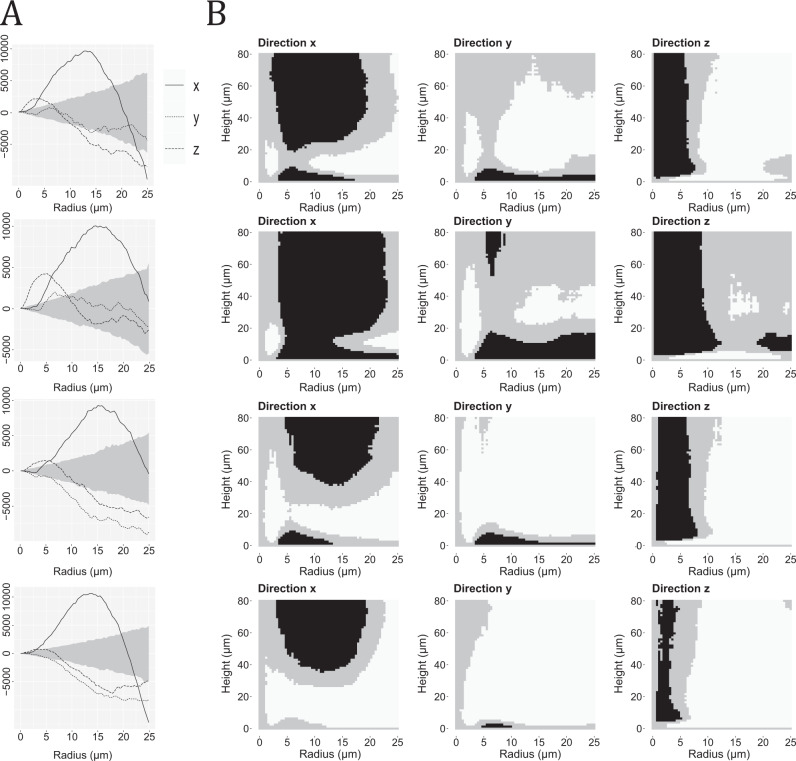
Fig. 6. Results of analyses with the cylindrical K-function for the spatial point patterns of centroids of pyramidal cells.
Each row represents a dataset which from top to bottom are Subject 1_1, 1_2, 2, and 3. A 95% global envelopes (shaded area) for the cylindrical K-function, with t = 80 fixed, and using 2000 CSR simulations. The theoretical value of the cylindrical K-function under CSR was subtracted from the curves for better visualization. The three curves correspond to the empirical cylindrical K-function for each dataset, in the direction of the x-axis (solid lines), y-axis (dotted lines), or z-axis (dashed lines). B Summary of 95% global envelopes for the four datasets based on the cylindrical K-function when varying both the height t and radius r. The envelopes are each based on 4000 CSR simulations. The direction of the cylinders is stated at the bottom of each plot. The plots indicate whether the empirical cylindrical K-function for the observed point pattern is above the envelope (black), within the envelope (gray), or below the envelope (white).

