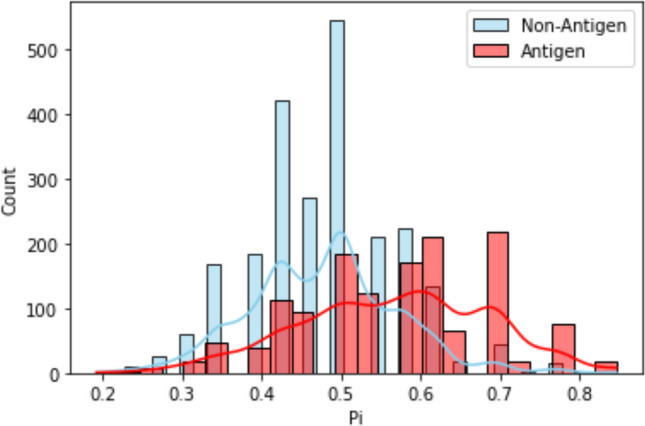
Figure 2.

Frequency distribution of Pi values based on the results from positive and negative datasets of bacteria, protozoa, fungi, and viruses. The Y-axis represents sequence count. The X-axis represents the *Pi score values for each sequence. Blue depicts non-antigen and red antigen sequences. *Pi stands for probability value where Pi = Si/N (where, Si refers to the row-wise sum values and N refers to the total number of the tools).
