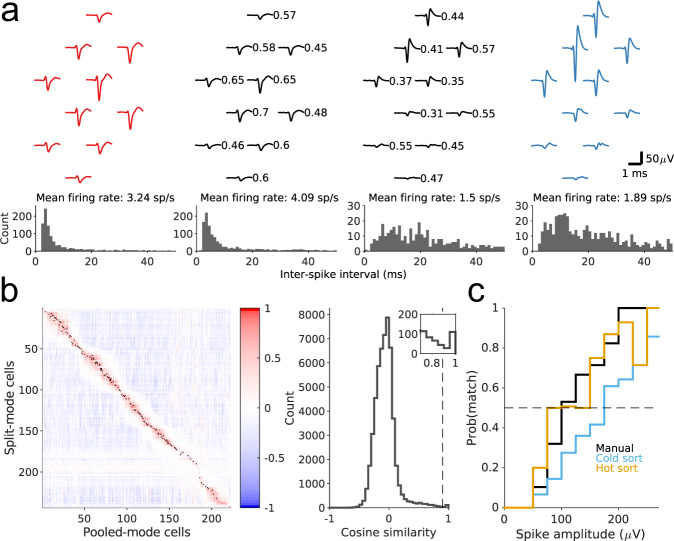
Fig. 5. Recordings from mouse brain.
a Matching spike shapes from split- and pooled-mode recordings. Top: Waveforms of two sample units (middle, black) detected in pooled mode on the same set of wires. The left unit was matched to a unit recorded in split mode from Bank 0 (red) and the right unit to one from Bank 1 (blue). Numbers indicate the scaling of the signal of the pooled-mode unit relative to its split-mode signal. Bottom: the mean firing rates and the interspike-interval distributions are similar for the matched pairs. b Left: matrix of the cosine similarity between units recorded in pooled- and split-mode, arranged by depth. Black dot indicates greater than the threshold at 0.9. Right: distribution of the cosine similarity. Dashed line indicates the threshold at 0.9. Inset zooms into the 0.7–1 range of the distribution. c Fraction of units from the two split recordings that are matched to a unit in the pooled recording as a function of spike amplitude. Three different sorting conditions are shown: sorting all recordings by KiloSort1 followed by manual curation (Manual), sorting all recordings by KiloSort2 (Cold sort), and sorting the pooled recording by KiloSort2 with templates initialized from the split recordings (Hot sort). Dashed line indicates 50%, or the `break-even' point where the pooled-mode yields as many simultaneous recordings as the average split-mode.

