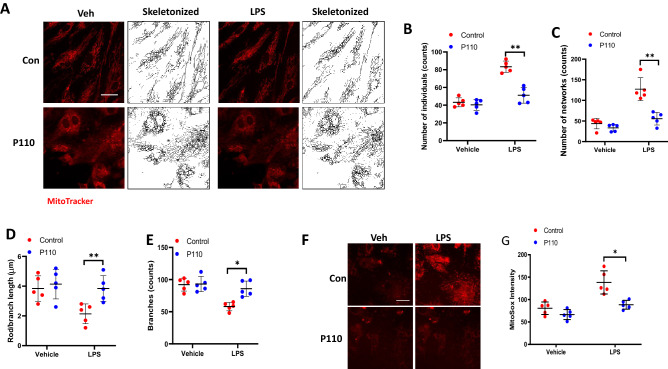
Figure 5.
DRP1 inhibitory peptide blocks LPS-induced EC mitochondrial fission and ROS. (A) HLMVECs were pretreated with DRP1 inhibitory peptide P110 (1 µM) for 1 h followed by adding of MitoTracker 10 min before imaging. Images were acquired at 5 min intervals. After 30 min imaging of the basal level of mitochondrial morphological information, cells were treated with 100 ng/ml LPS followed by continuous imaging of mitochondria at the same intervals. Presents are images acquired before LPS treatment (Veh column) and after LPS treatment (LPS column). (B–E) Mitochondrial dynamics was assessed by number of individual fragments, number of networks, rod/branch length, and branch counts. Data were presented as means ± SD, for number of individual fragments, **p < 0.01, LPS alone versus LPS + P110; for number of networks, **p < 0.01, LPS alone versus LPS + P110; for rod/branch length, **p < 0.01, LPS alone versus LPS + P110; for branch counts, *p < 0.05, LPS alone versus LPS + P110. (F) HLMVECs were treated same as described above, instead of using MitoTracker staining, cells were treated with 5 µm MitoSOX for 10 min before imaging. Shown are representative of at least 5 images. Scale bar 10 μm. (G) MitoSOX intensity analysis, *p < 0.05, LPS alone versus LPS + P110.

