
Fig. 6. Correlations between task-related BOLD responses during MSL and baseline GABA+ measures.
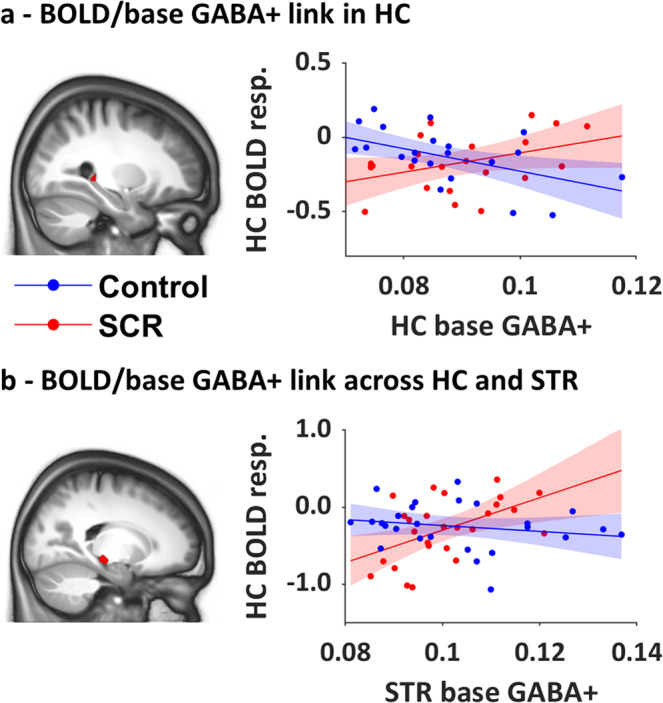
For display purposes, activation maps are overlaid on a T1-weighted template image with a threshold of p < 0.005 uncorrected. Regression plots represent BOLD responses (resp.) [practice > rest] against baseline GABA+ measures for the two groups. a Link between BOLD and GABA+ within the HC: right HC activation [28 −36 0 mm] was differently correlated with HC baseline GABA+ in the SCR and control groups. b Link between BOLD and GABA+ across regions: left HC activation [−18 −24 −10 mm] was differently correlated with STR baseline GABA+ in the SCR and control groups. Due to missing fMRI data, one control participant was not included in the regressions with HC GABA+: N Control = 23, N SCR = 22. Regressions with STR GABA+: N Control = 26, N SCR = 26. BOLD and GABA measures are in arbitrary units.