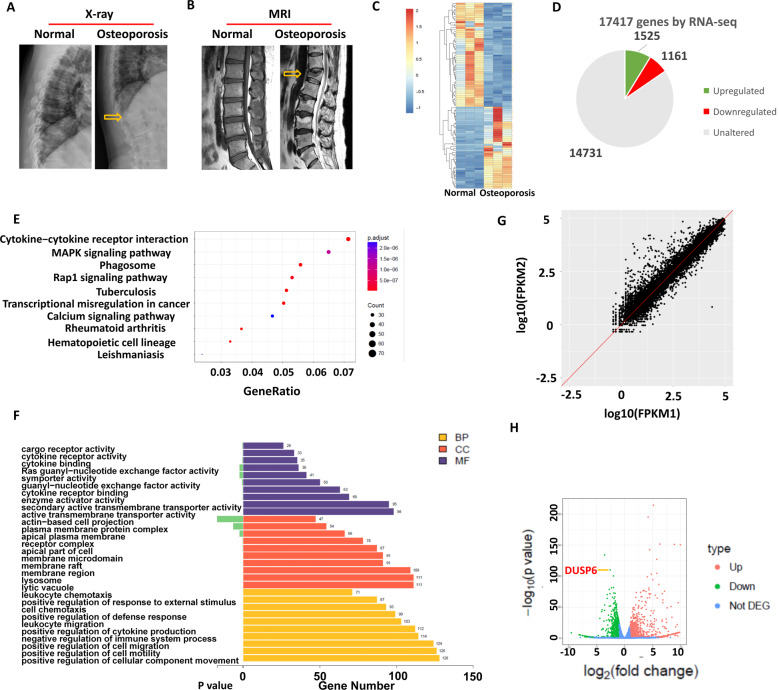
Fig. 1. Gene microarray identified the altered gene expression of DUSP6 in osteoporotic bone tissues.
Normal and osteoporosis patients were arranged for X-ray (A) and MRI (B). Bone tissues form vertebral body were collected from the two groups (n = 3). Gene microarray analysis was carried out to explore the differential gene expression and shown as heat map (C). The number of upregulated and downregulated genes were shown (D). KEGG (Kyoto Encyclopedia of Genes and Genomes) analysis were shown to identify the significant signaling pathway (E). GO enrichment analysis were carried out. CC cellular component, MF molecular function, BP biological process (F). The differential gene expression scatter plot in the two group was shown as log FPKM (Fragments Per Kilobase Million) (G). H The volcano map of differential genes was shown. The dot of Dsup6 was shown (red arrow).

