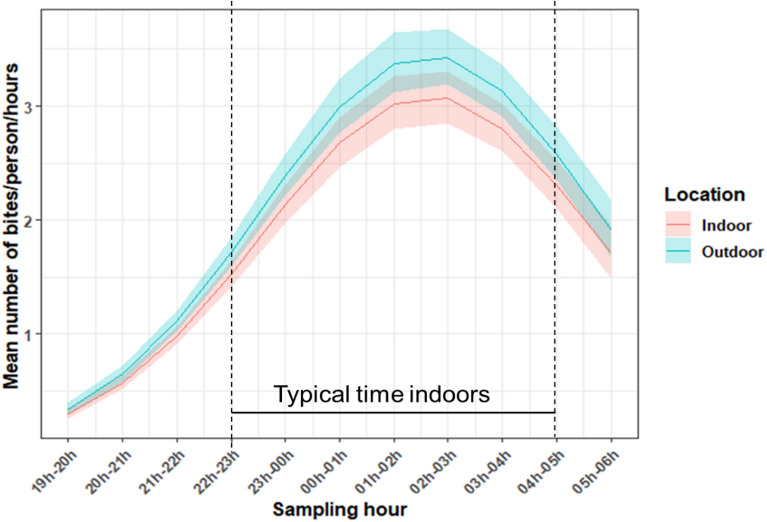
Figure 3.
Mean number of An. gambiae s.l. biting per hour (as assessed from Human Landing Catches) in 12 villages in southwestern Burkina Faso, from October 2016 to December 2018. Data are pooled over village and collection period. The period between the black vertical dashed lines indicates when most people are inside their dwelling and estimated to be sleeping under a nets. The blue and red curves indicate the predicted number of An. gambiae s.l. biting in outdoor and indoor settings, respectively; with the shaded areas indicating the 95% confidence intervals.

