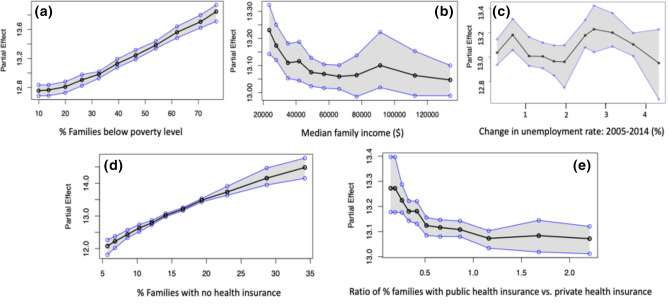
Figure 1.
Partial Dependence Plots (PDPs) of the key socio-economic aspects of the built environment: (a) of families below poverty level, (b) median family income, (c) change in unemployment rate, (d) families with no health insurance, (e) ratio of of families with public health insurance vs. private health insurance. In each sub-figure, on the , the values of the particular independent variable is plotted, and on the , the partial effect of the independent variable on the response variable is depicted. The black curve is the average partial effect of the predictor variable and blue lines indicate the confidence intervals.

