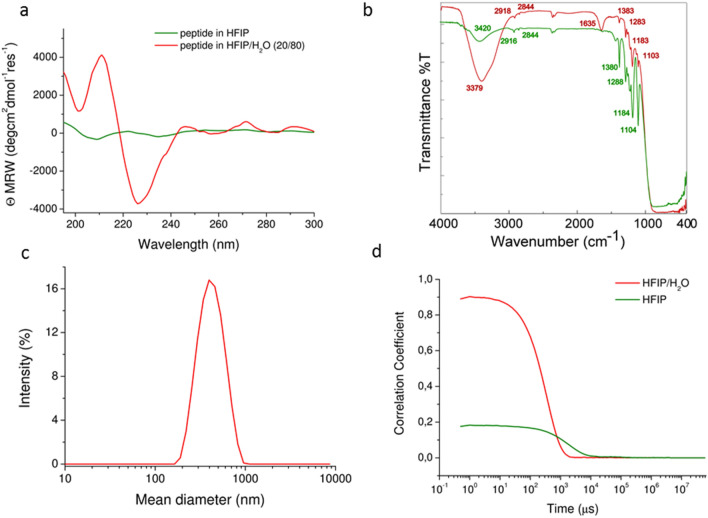
Figure 2.
Structural characterization of Rho-PEG1300-F6 in solutions. (a) CD spectra of Rho-PEG1300-F6 in HFIP at a concentration of 5 × 10⁻³ M and in HFIP/H2O (20/80) at a concentration of 1 × 10⁻³ M. (b) FTIR spectra of the peptide in HFIP (green line) and in HFIP/H2O (red line) at a concentration of 5 × 10⁻³ M and 1 × 10⁻³ M. (c) DLS profile of Rho-PEG1300-F6 in HFIP/H2O at a concentration of 1 × 10⁻³ M. (d) Correlation functions of the peptide in HFIP and in HFIP/ H2O (20/80).

